IoT is currently becoming more and more popular as the leading technology in logistics worldwide. Used on an everyday basis, it is estimated that this year (2021) the number of connected IoT devices will exceed 25 billion. Therefore, we need to first clarify just what IoT is and how it works before diving in deeper. Next, we’ll take a look at some examples and how IoT can help implement solutions for more Sustainable Transportation.
Global eco challenges for Sustainable Transportation
The Internet of Things (IoT) is defined as a network of devices that communicates with each other and exchanges data over the Internet. The objects or “things” are equipped with various types of sensors, transmitters, and receivers, which are connected and form a network that can be analyzed and examined.
Depending on the statistics, road transport is reported to be responsible for 10-15% of all CO2 emissions into the Earth’s atmosphere. Global freight transportation is increasing every year and it is estimated to grow by 60% by 2050. We can already see an increase in the awareness and willingness to respond among individuals, enterprises, and governments. Many global organizations are taking action to reduce the impact and fight against climate change. For one, the Paris Agreement enforces a 45% reduction in CO2 emissions in transportation by 2050.
.jpg?width=1024&height=402&name=160321_IoT_AA-2-1024x402-(Compressify.io).jpg) Paris agreement emission reduction targets
Paris agreement emission reduction targets
The European Climate Pact is an organization that brings together both countries and companies. Its aim is not to prohibit, but to support and assist in creating new interconnected initiatives, that can help build more efficient transport with reduced emissions.
These initiatives are making us rethink our strategies and are forcing us to try to find more effective solutions in our industries to help tackle the global ecological crisis. For example, one such solution in transportation is multimodal (or combined) transport – a practice that has been used for years. However, the number of variables and complexity of the matter requires the use of multiple devices and systems that bring an overwhelming amount of data. And this is where IoT devices and advanced analytics come into action to help us out.
IoT solution basics and system setup
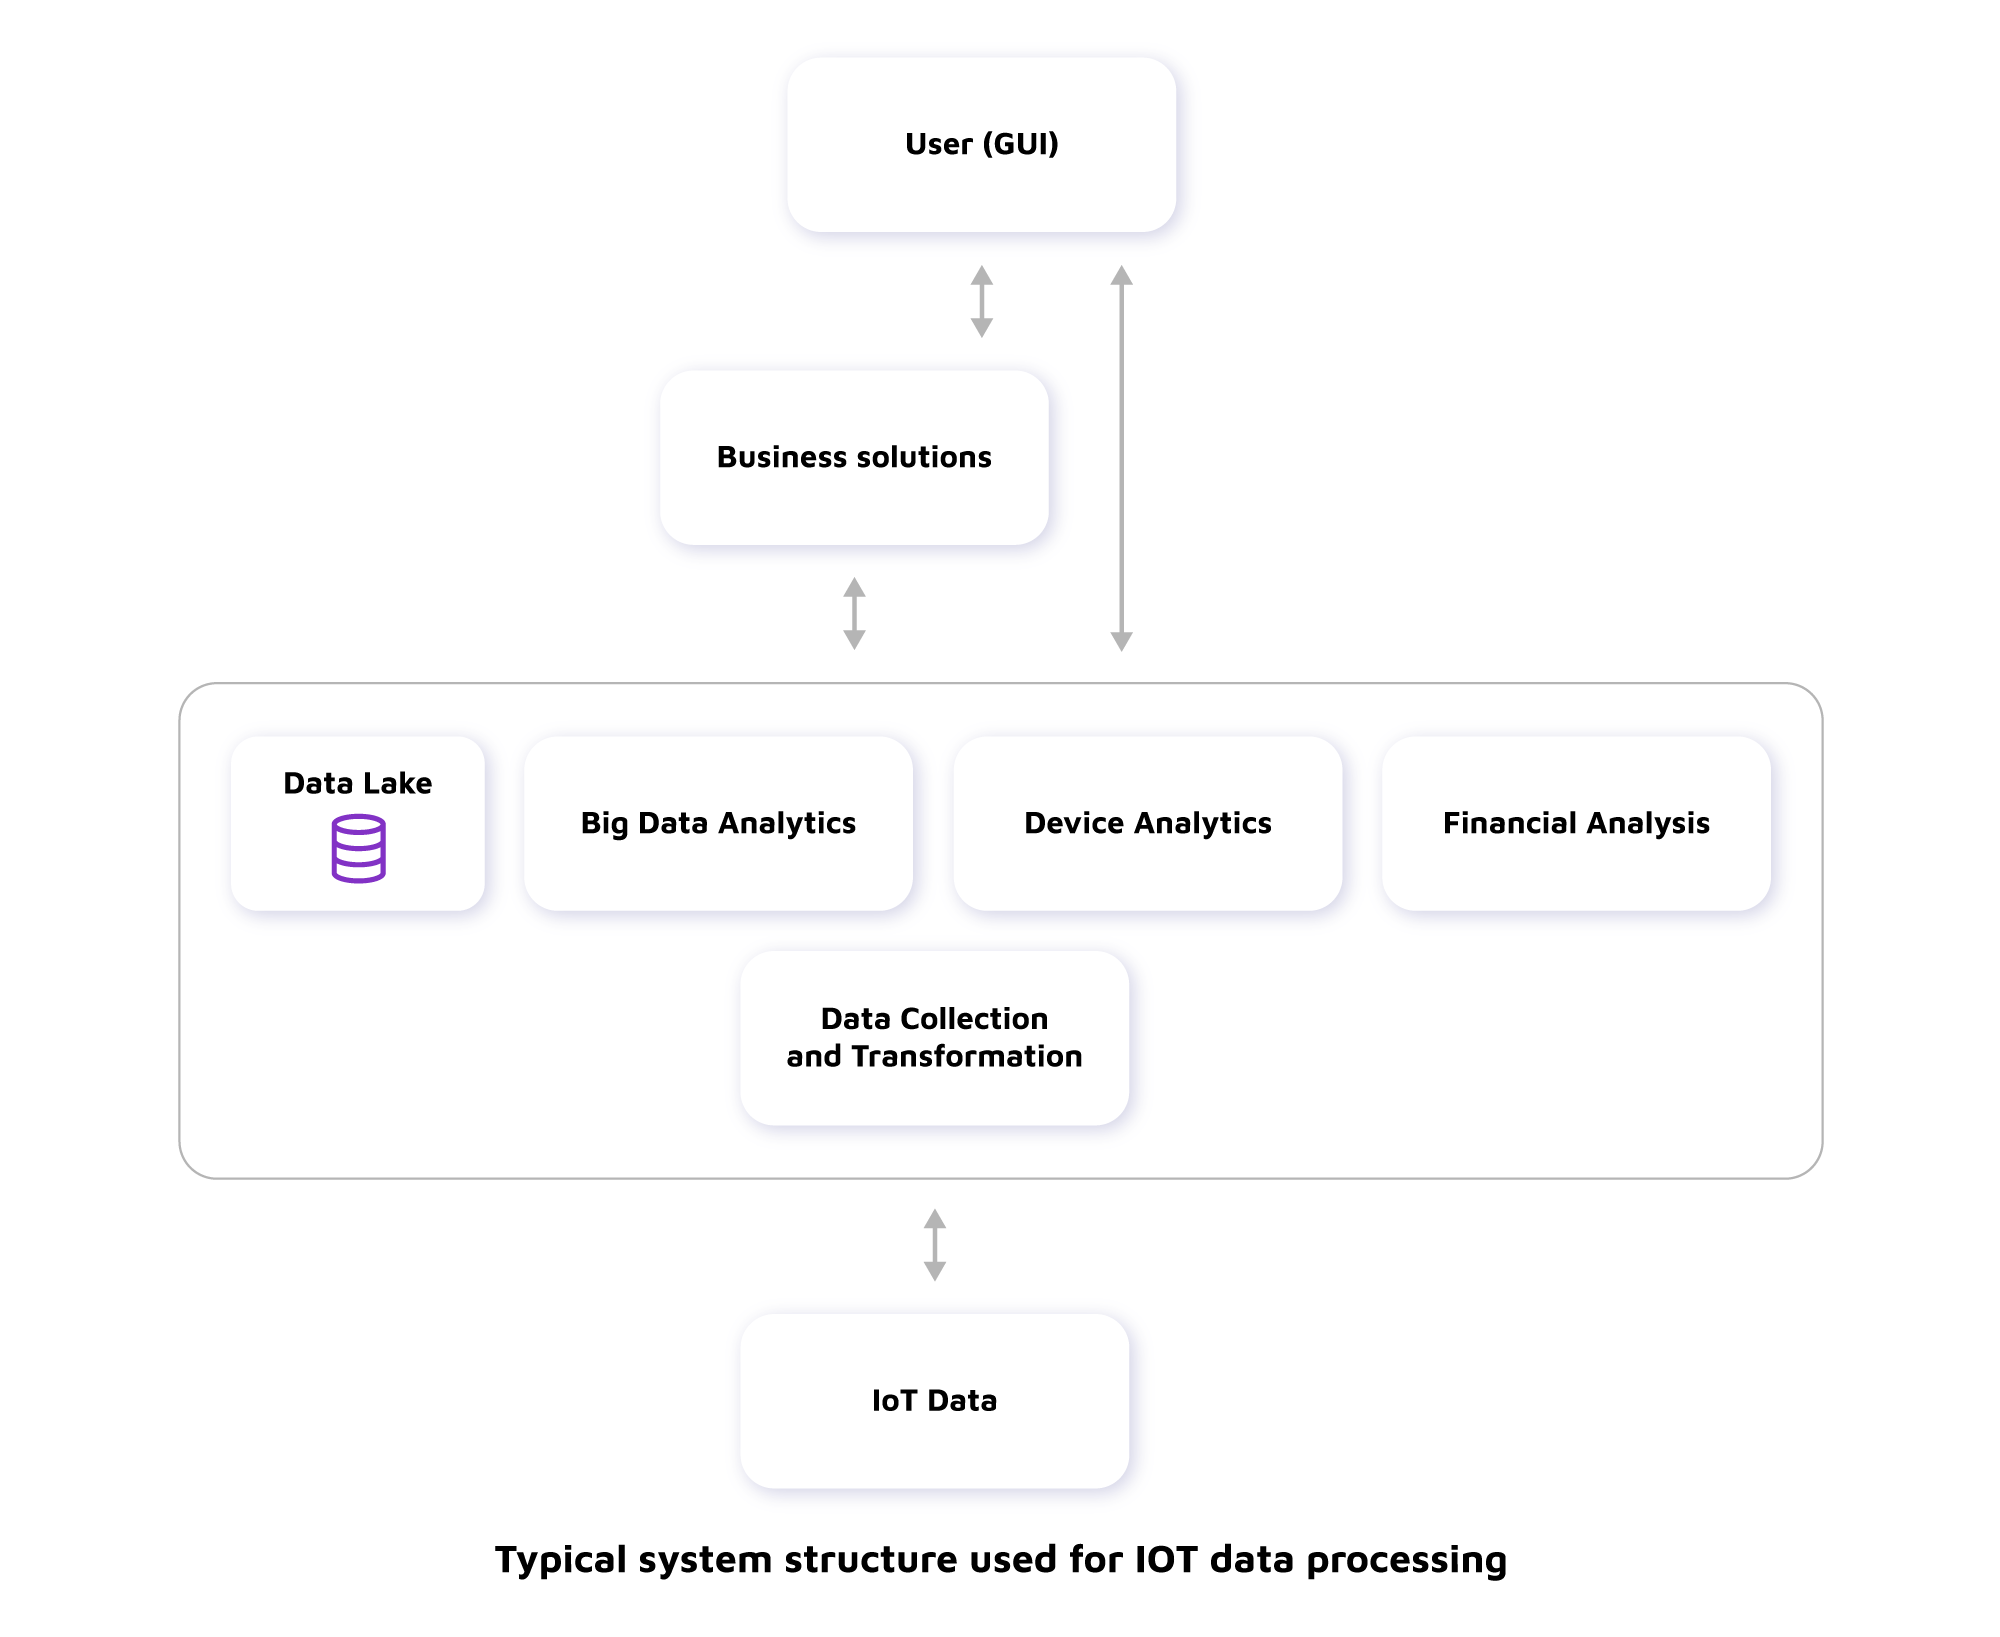
IoT solutions can be divided into 3 logical layers. For now, we will focus on the first and third layer. The first one consists of electronic devices that can collect, send, and sometimes even receive data. As an example, we can point to the mobile phone in our pocket, beacons that monitor the humidity in shipments, or automatic customs seals.
This group also includes modern washing machines and refrigerators. In some cases, the devices are not constantly connected to the internet, whether for technological reasons (small Bluetooth range) or because of temporary loss of network connection (in the case of sim cards). This doesn’t mean the devices are no longer part of the IoT world, they just need to cache data and periodically upload and sync it. Obviously, the more frequent the transfers, the more live the data is. However, when building neural prediction networks, the frequency of data is not as important as its accuracy and regularity.
.jpg?width=1024&height=279&name=160321_IoT_AA_2-1-1024x279-(Compressify.io).jpg)
A typical beacon can collect data from GPS on temperature and humidity. It does not have permanent access to the network, it synchronizes when it is within range of a Bluetooth transmitter. Such transmitters can be, for example, at the entrance to a warehouse. The advantage of this solution is the price – just a few dollars per unit, and the duration of operational activity can last up to several years. Beacons may come in various shapes with reinforced cases and can be made from custom materials.
.jpg?width=714&height=340&name=160321_IoT_AA_6-1024x487-(Compressify.io).jpg)
With the right application, our phone can also become part of the IoT environment, as well as actively control it.
The second layer from which we can get the most profits, is the one in where the analysis is carried out. This is where great progress has taken place, and this is where all the “magic” happens.
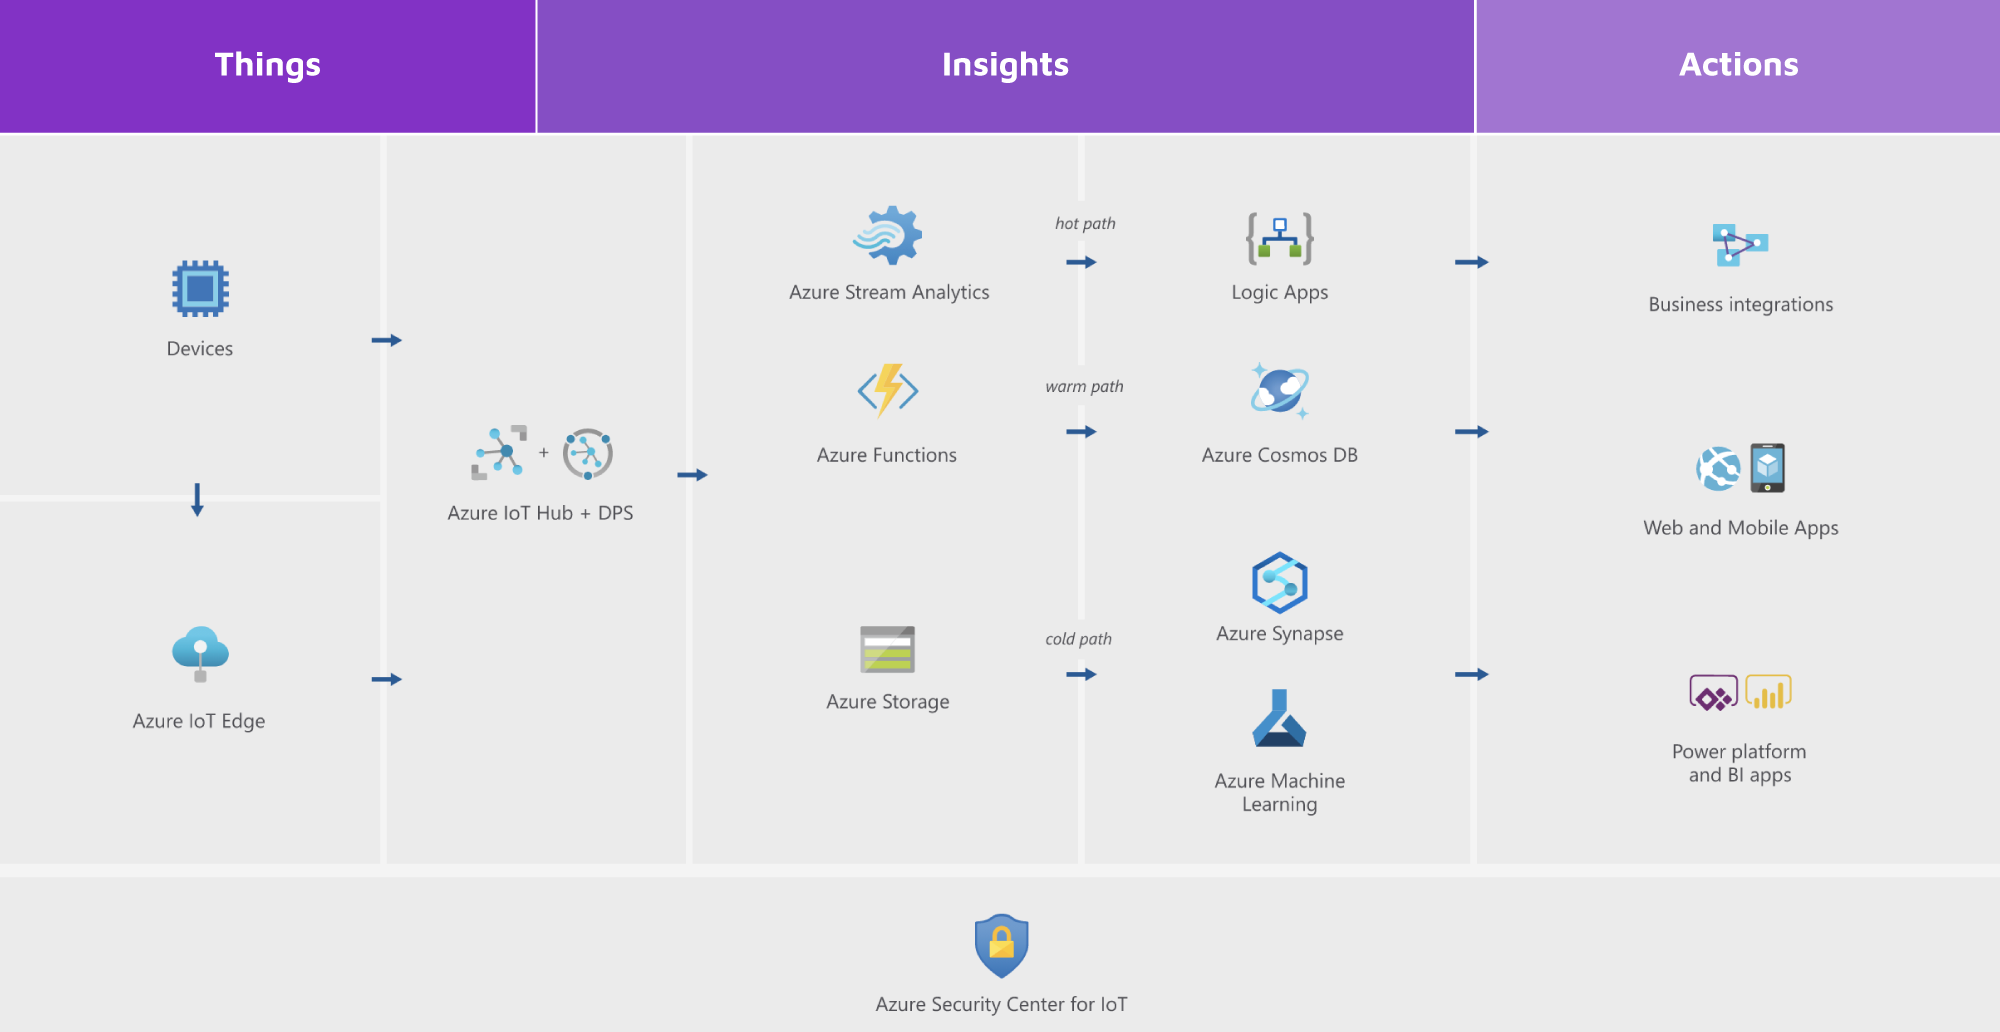
The most important element of this layer is the Data Lake. It is the central repository that stores all the data in both structured and unstructured forms. Storing in the original format is just the beginning of the transformation and potential uses. Nowadays, Data Lakes are most often located in the cloud, offered by one of three main providers. Although of course, it is possible to create your own cloud and your own repository.
Each of these three providers has advantages and disadvantages. If we take the Microsoft approach for example, we will see it offers very well-designed support, with Azure’s well-developed management system that provides dedicated tools for migrating. If you have already used MS SQL before, you will immediately figure out the environment and quickly understand how to use it.
Having such service gives us increased availability, greater security of the stored information, and most importantly, scalability. The last point is very important from the environmental point of view because we can adjust the resources to meet our needs, by increasing or by reducing computing power. The servers are located in places where their energy consumption (including generated heat) is optimal, and the addition of further resources happens smoothly and seamlessly.
Once we have the environment in which we can embed our data, we enter the space of its processing. We have a lot of suppliers at our disposal and the choice can depend on many factors, from financial issues, through corporate arrangements, to our people’s technological knowledge. It is here that we process, aggregate, archive, and transform the collected information, so that it can be used by other systems. Meaning, we send it to relevant applications such as WMS, TMS, etc.
Once we have our data collected, we come to the most interesting part – which is the analytics. This area has been developing most rapidly recently, and we shall also focus on this in our upcoming articles. It is important to note here that just as in the databases, analytics has powerful tools for data mining, processing, robotization, and data preparation. These can be open source or paid products, so the choice depends on both what we want to achieve, as well as on our own preferences and skills.
The final step is the visualization, which depends on the costs (how much we can invest), as well as preferences. The end user is usually not IT, so it requires a clear and comprehensive form. It’s important to note that we make strategic decisions based on these tools, so choosing them is crucial. We also need to remember that reporting must be simple and understandable, so that everyone in the organization can carry out their analysis.
Popular data visualization tools
Each of these tools works well, but it is important to remember that not all are equally flexible. It is also crucial to create object worlds (and reports based on them) in such a way that they are most efficient.
IoT data processing and green transport implications
Now with the environment set up, we can collect our IoT data and move on to using it to support sustainability in transport. When aiming to reduce the carbon footprint, our task is to try to put the “=” sign between sustainable development and profitability.
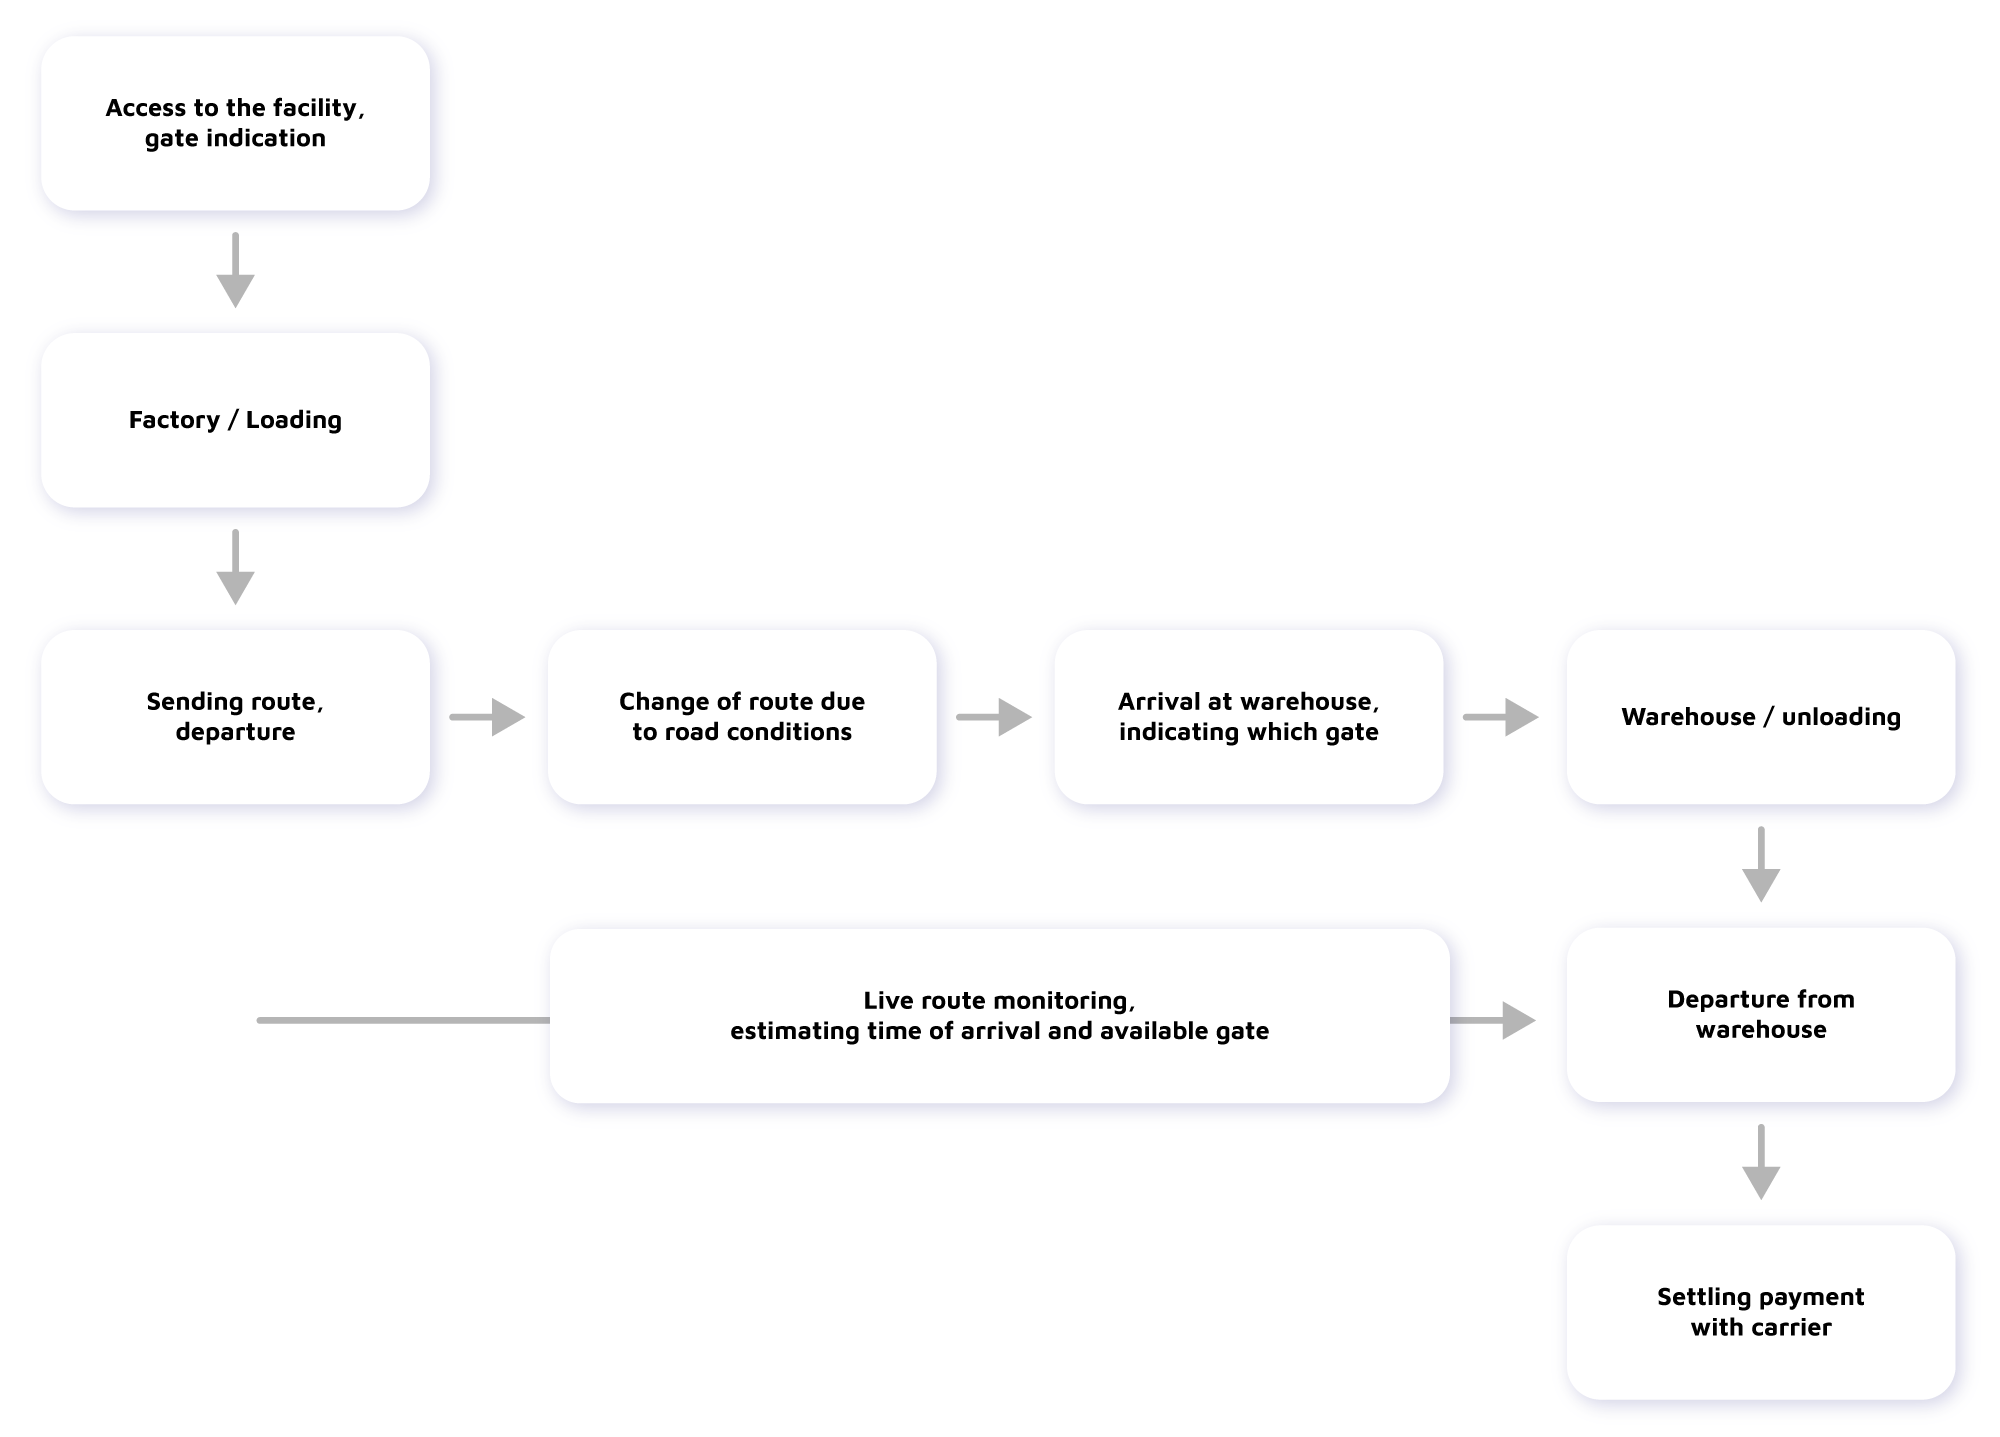
The first tool that can support our pro-environmental approach is a phone app that uses a built-in GPS and sends data to the system on the fly. It gives the driver an estimated time of arrival at the destination. But that’s not all. With the whole system at our disposal, we can send information about the planned time of unloading, as we have fresh data from the yard management system available.
In addition, the system can immediately indicate and set a route to the specific unloading warehouse gate. We may also send information – like that the driver has to make an extra stop to retrieve additional stock. Traffic data can also be shared live, with recommendations on changing the route (due to traffic obstructions), or with suggestions on eco-driving (dust from brake discs also pollutes the environment). In the application we may also receive delivery confirmations, that allow the system to automatically generate invoices for the carrier.
Example IoT supported transport process between plant and warehouse with a route change during the journey. The process is automatic and does not require any interaction from the driver.
A vehicle that is starting or moving uphill consumes more fuel, which later translates into an increased carbon footprint. With the help of IoT data, we can start designing routes to see if potential changes and extensions would ultimately lead to additional savings. For now, we’re just talking about a phone app. Once we support it with the beacon ecosystem, we’ll get more information and expand our possibilities even further.
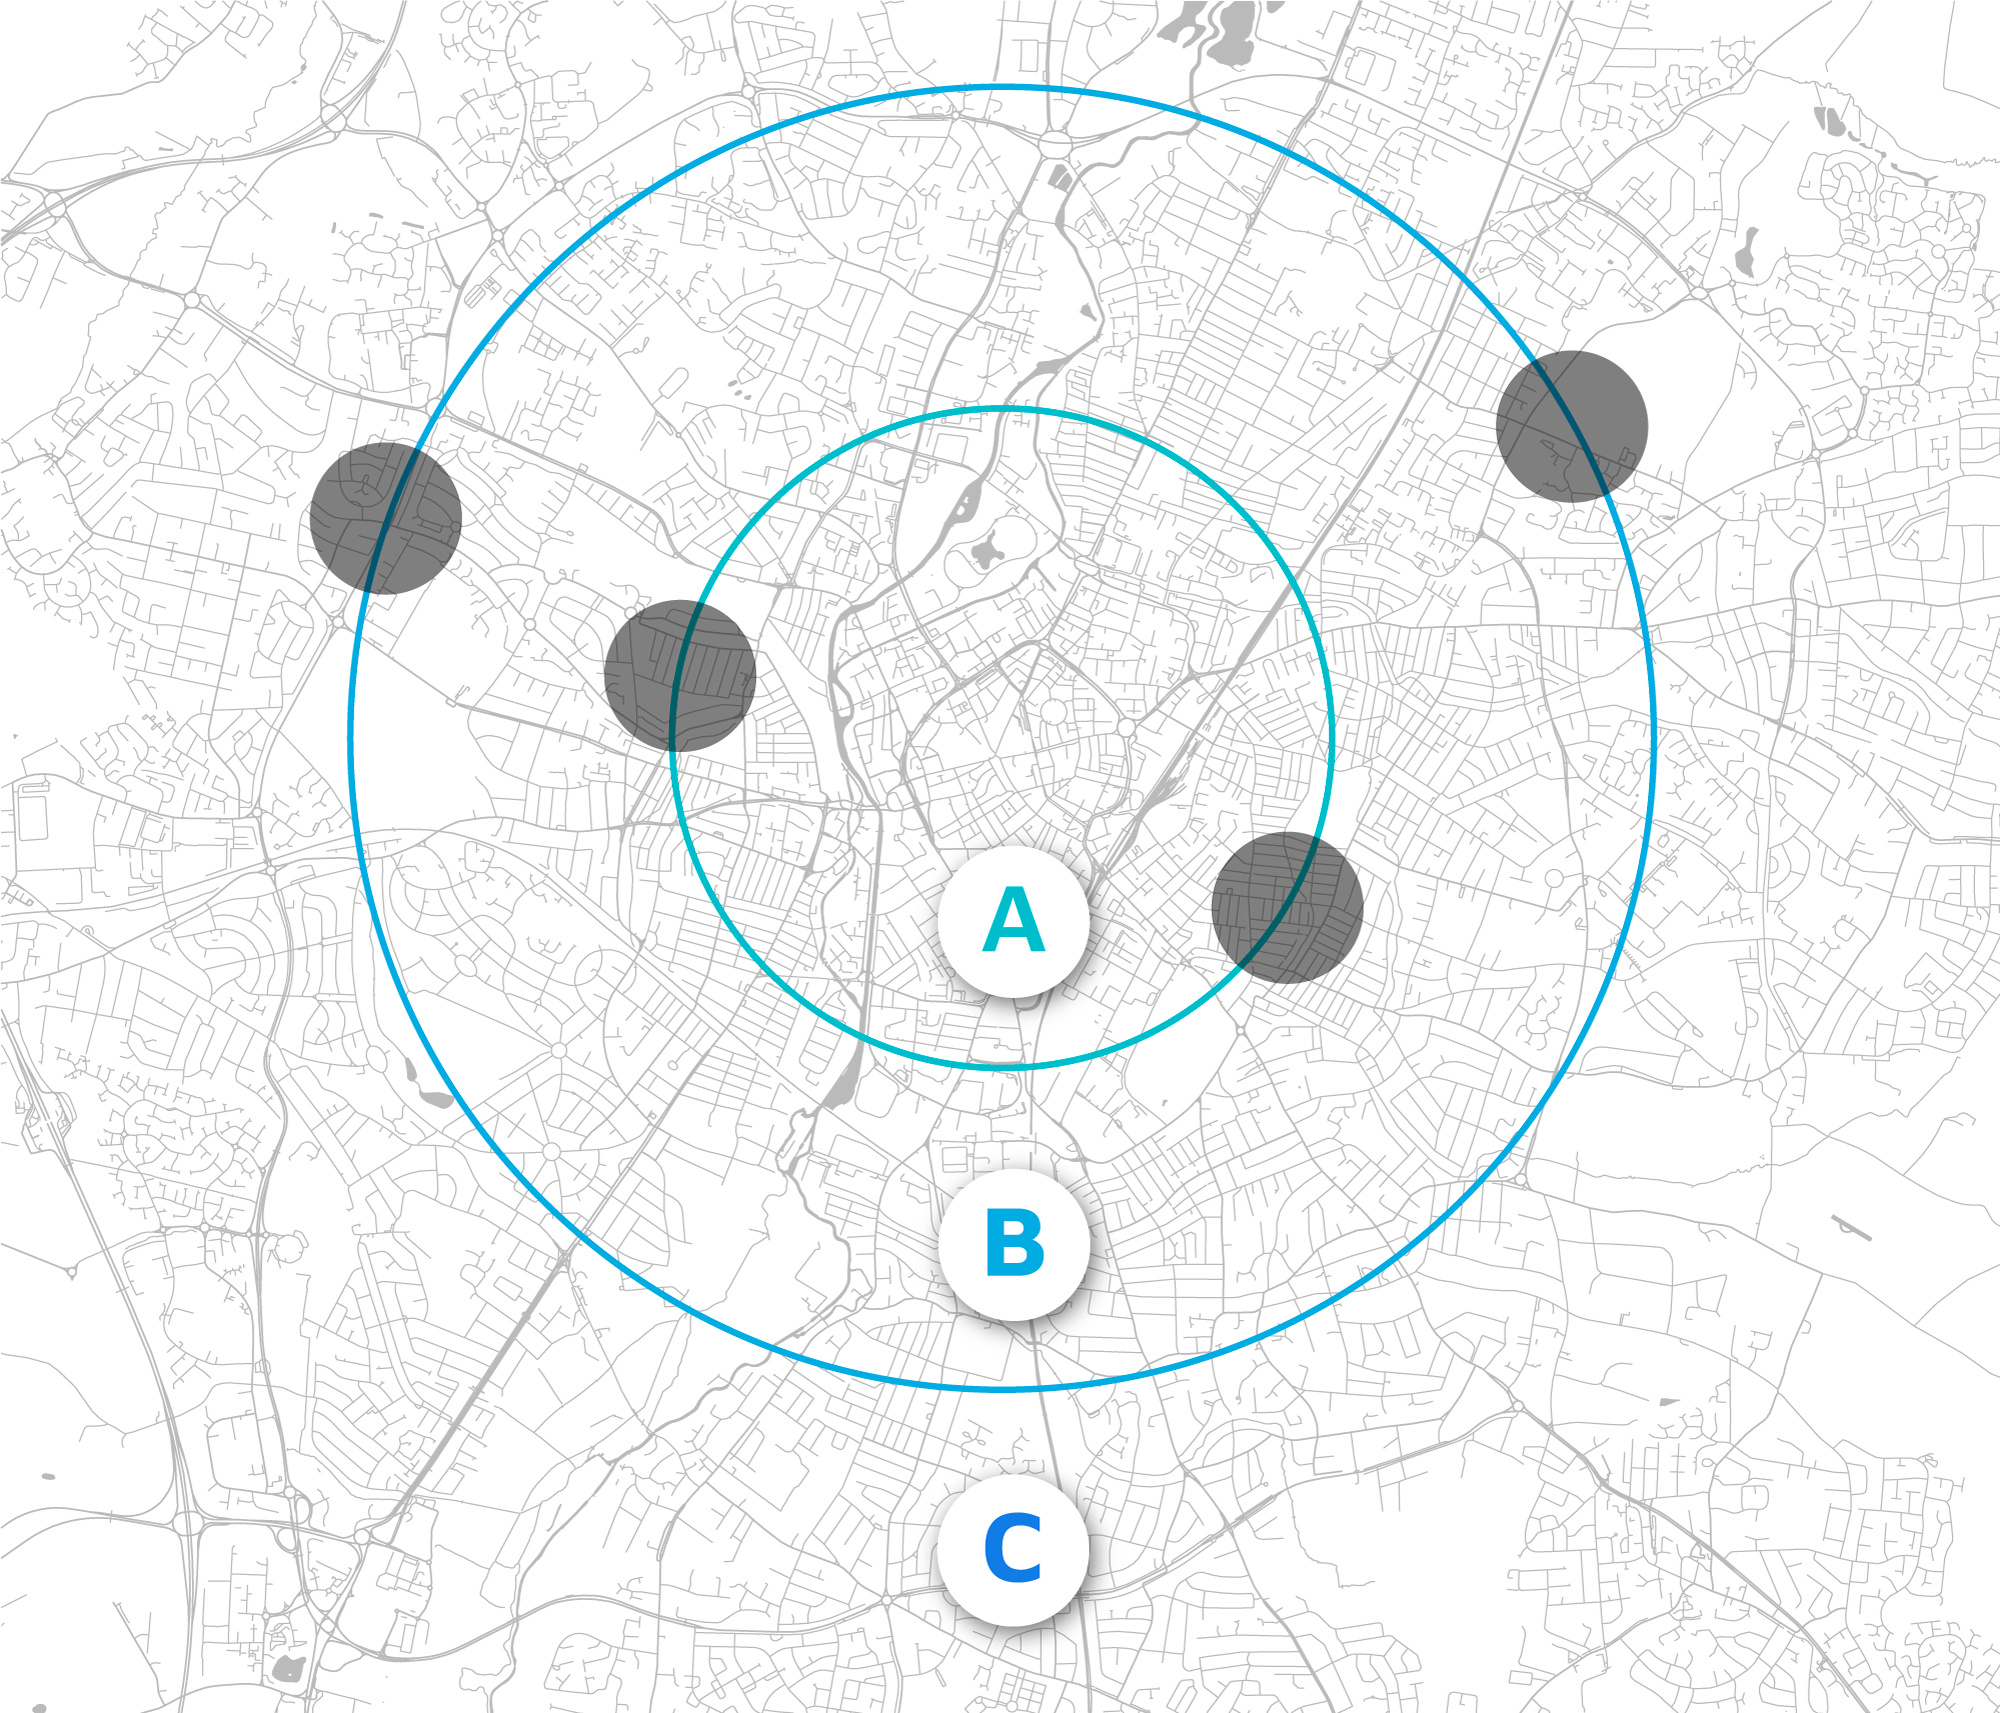
Based on the collected data, the system can indicate best locations for potential transit points (HUBs)
Globally a trend is beginning to prevail, where only individual categories (sizes) of vehicles have access to specific city zones. This type of zoning has an environmental basis that aims to reduce traffic. In addition, we need to remember that there are areas where large trucks are banned in certain hours or that there are weight restrictions.
However, our customers are in the city. What can we do to create the most optimal routes? Based on data from the system, we can indicate the best zones for creating reloading and transit points. This will make us use smaller vehicles in the case of trips to city centers, or larger ones in the case of leaving restricted zones.
On top of that, we often try to ensure the trucks are always filled to maximum capacity, so as not to make empty runs. And we find ourselves thinking if we should have chosen the smallest truck (HDV → LDV) to start with. Processing IoT data will provide these answers, so we can plan our routes using data previously generated by the system and data collected from other providers, such as Google.
The traffic conditions are a result of the equation where we have historical data, from Google for example, and the route is determined by taking optimal loading points into account.
The formula looks simple but hidden underneath there are hundreds, if not thousands, of variables that the system analyzes and learns from to improve the quality of the results. In addition, we can boost it with extra information from more sensors. For example, from a fuel gauge sensor in the tank, which will add even more precision to our calculations. It might turn out that a smaller truck will use less fuel on a given route, lowering the delivery costs and environmental impact. Therefore, it may be worth considering to invest in a fleet of smaller vehicles.
Of course, we can collect all this data ourselves and convert it into a simple spreadsheet. But the problem grows with the scale. In the case of a fleet with hundreds of trucks, that have several stops per day, which can actively change, it is not possible to do all these calculations manually. Let us not forget that in addition, IoT data is presented in real time, which allows for faster responses. The IoT sensors also allow to determine the average fuel consumption, to help regulate estimates and adjust usage plans. Automatic schedules for refueling can then be marked on the map and added in as specific fuel stop points on map for the driver.
Sustainable Transportation – Key results and benefits
Using algorithms and advanced analytics can reduce energy use and lower a company’s carbon footprint by allowing to make informed decisions based on detailed data. Optimizing routes gives us control over CO2 emissions and with each subsequent case the system learns to make further reductions. Routes can be altered and even extended to lower fuel consumption. Shipments may be rescheduled for the next day as there will then be several more deliveries at a similar location.
In conclusion, IoT is crucial in transport and will play a key role in managing operations to minimize negative impacts on the environment. The growing awareness gives us room to adapt and helps support the adoption of green technologies.
With these new systems, we can monitor, analyze, and improve operations. By analyzing both historical data and by using what IoT devices send in real time during operations, we can better respond to changing factors and circumstances.
Therefore, to sum up, data analytics can empower businesses to not only optimize operations and reduce costs, but to use the visibility and insights to:
-
Reduce fuel consumption – resulting in real savings
-
Improve reaction flexibility – responding to any situation immediately, whether it is a traffic jam or change in the market
-
Increase efficiency – reducing manual work, by loading data automatically and providing recommendations
-
Support operational transparency – to control operations remotely by modifying system parameters on the fly and altering routes
-
Make informed decisions – based on data, in all key areas like purchasing and fleet changes
-
Improve delivery timing, including OTD (on time delivery)
-
Reduce waste – optimized deliveries with less spoiled cargo
-
Improve brand reputation – by setting and achieving project goals that strengthen the company’s environmental performance


