Turn Data Into Action
for Every User, Every Day

Equip business users with the tools, trainings, and insights
to act fast across Power BI, Qlik, Tableau, Domo, and more.

Our capabilities

Data-Visualization

Dashboard & Reporting Solutions

Design and implement high‑performance data visualization and BI analytics with leading data visualization tools and software—tailored to your priorities.

  • Power BI
    End-to-end Power BI service from a Microsoft partner: implementation, governance, BI performance services, and training.
  • Tableau
    Custom Tableau data visualization, optimized models, and data visualization techniques that accelerate decisions.
  • Domo
    Scalable big data analytics tools from pipelines to dashboards and governance - for big data and data analytics use cases.
  • Qlik
    Impactful Qlik data visualization software, efficient architectures, and full integration with your analytics ecosystem.

Accelerated BI Migration and Adoption

Migrate to modern data visualization tools like Power BI or Tableau with minimal disruption.

Self Service Analytics & Adoption Enablement

Empower users with governed, intuitive self‑service data visualization programs and tools.

UX/UI Services

Design intuitive, human-centric experiences that simplify complex data tools. Combine design thinking, AI, and creativity to build products users adopt. Deliver UX/UI audits, design systems, templates, and role-based training to drive adoption.

Reporting Factory

Scale delivery across data visualization programs with tiers, reusable components, and streamlined workflows.

Data Analytics & BI Adoption

Scale BI analytics with guided adoption journeys for business and technical users.

Intelligent Report Catalog

Enrich BI assets and data visualizations to reduce duplication and build trust.

What is your challenge?

Talk to us

Our partnerships

Proven Success

10,000+ Users Enabled for BI

Global Beverages Manufacturer

Challenge we solved:

  • Fragmented data, BI skills, and manual reporting.

Impact delivered:

  • 10,000+ users enabled for self-service BI
  • Faster insights via self‑service BI enablement.
  • $2M saved with $3.5M new value in 1.5 years.

30% Fewer Duplicate Reports

CPG Company

Challenge we solved:

  • 500+ scattered reports, low adoption, duplication.

Impact delivered:

  • 30% fewer duplicates using AI Report Catalog
  • Higher trust, easier discovery of BI reports
  • Central access point for insights across teams

Scalable BI for 200+ Users

Global CPG Company

Challenge we solved:

  • Scaling was blocked by low standards driven by reliance on Excel/CSV.

Impact delivered:

  • 100+ reports built in Power BI.
  • Reduced cost and delivery via Reporting Factory
  • Strong, scalable foundation on Power BI Service.

Rapid Risk Dashboard

Global Enterprise (COVID-19 Response)

Challenge we solved:

  • Opaque data, no supplier risk visibility.

Impact delivered:

  • Procurement Analysis dashboard delivered in 3 weeks.
  • Stronger risk ID, KPIs, and visualization.
  • Better decisions across regions and/or categories.

The Lingaro Advantage

DOMAIN

Deep technical and business expertise
We bridge technology and commercial insight, partnering with leading hyperscalers to deliver data and AI solutions for real business problems.

DESIGN

Human-centric, AI accelerated experiences
We combine design thinking, AI, technology, and creativity to build user-focused experiences that connect with people and earn trust.

ADOPTION

5x faster
with 7 accelerators

We drive usage and ROI through in-house learning, change expertise, and a proven AI-powered adoption framework.

Featured topics

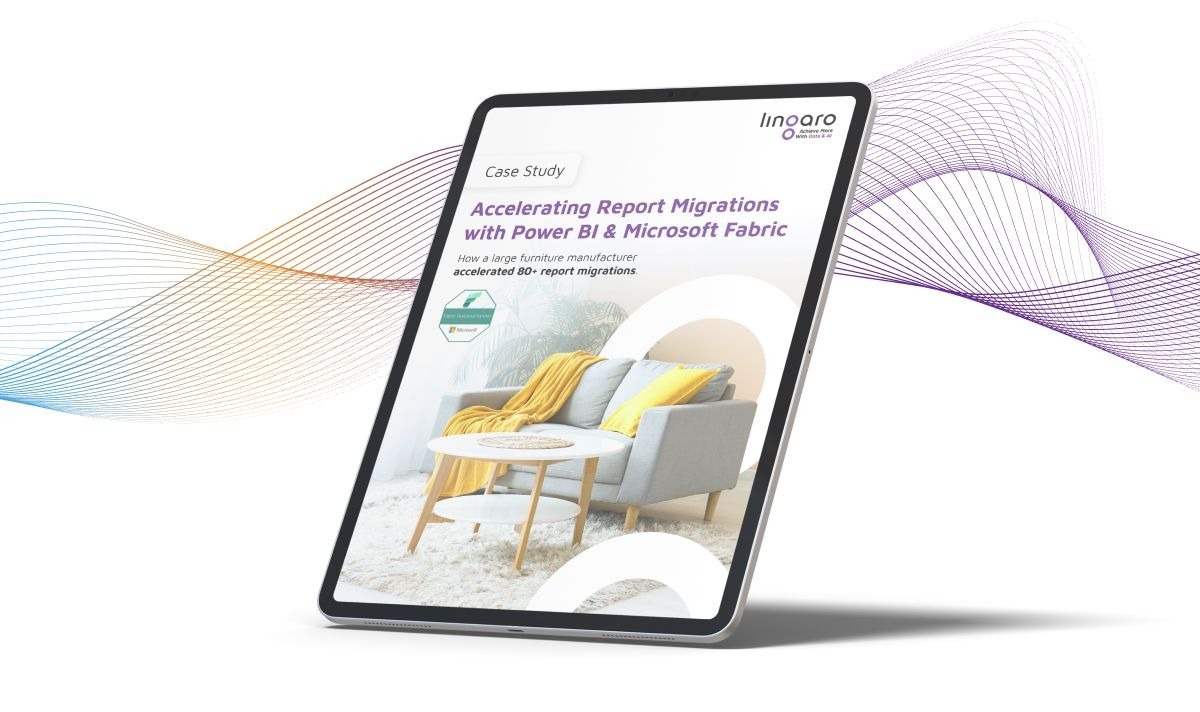
Case Study: Report Migration from QlikView to Power BI and Microsoft Fabric
Data Visualization
Case Studies

Case Study: Report Migration from QlikView to Power BI and Microsoft Fabric

How one of the world’s largest furniture manufacturers accelerated the migration of 80+ legacy reports by moving from QlikView to Power BI and Microsoft Fabric, meeting a strict license expiration ...

Read more
Go to Insights

Contact us

Turn your data into insights that drive business impact.