Now live across six markets and accessed through interactive Power BI dashboards, the price elasticity and scenario simulation platform allows pricing teams to model price changes and assess their potential impact on volume, net sales value, profitability, and the wider portfolio. Selected analyses that previously took weeks now take minutes.
Challenge
An international beverage company needed a faster, more consistent way to assess pricing opportunities across markets and product groups. Monthly spreadsheets and quarterly elasticity estimates made it difficult to respond quickly to changing market conditions, separate price effects from other demand drivers, and understand substitution across the portfolio. Inflation, shifting market prices, and growing pressure on margins increased the need for faster, more reliable pricing insights.
Solution
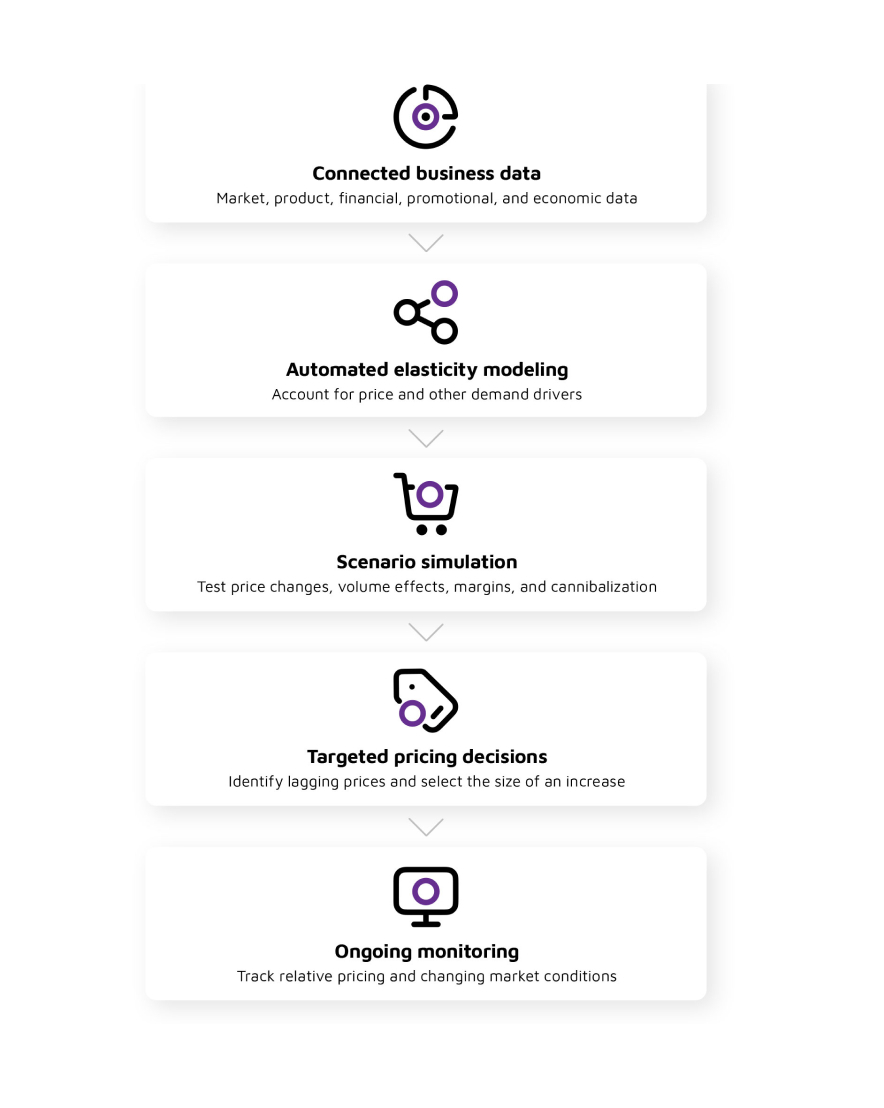
As part of our Revenue Growth Management (RGM) offering, we developed a price elasticity and scenario simulation platform that brought market, product, financial, promotional, and economic data into one environment. Teams could model own-price and cross-price elasticities, simulate pricing and other commercial changes, and compare their potential impact on volume, net sales value, profitability, and the wider portfolio.
Why it works
Domain
Combining Nielsen sales data with product, distribution, promotional, financial, and market data helped teams account for the drivers of beverage demand. They could assess pricing across markets, categories, channels, brands, products, and pack sizes, model own-price and cross-price elasticities, and distinguish cannibalization from net brand growth.
Design
An interactive Power BI environment brought pricing data, elasticity insights, and scenario simulation together. Users could simulate pricing and other commercial changes, explore their effects on volume, net sales value, profitability, and cannibalization, and save, compare, and share scenarios.
Adoption
The solution was rolled out progressively across six markets. Around 20 users completed more than 10 expert-led training sessions, supported by detailed guidance, model performance reporting, and feedback from pricing meetings. The platform remains live in production for regular use by local and global pricing analytics teams.
Results
- Weeks to minutes for selected pricing analyses
- 6 markets supported through a phased rollout
- 15+ active users across local and global pricing analytics teams
- Data refreshed every two weeks to support regular pricing analysis