Previously, we delved into how enterprises can optimize their data and analytics costs. In this, our last post in the Data ROI series, we’ll show you ways in which your business can unlock the full value of your data.
Businesses might have a good handle on their structured data — one that fits easily into rows and columns of relational databases, such as dates and statistics. However, IDC estimates that by 2026, 80% – 90% of data created annually will be overwhelmingly unstructured:
-
Bodies of emails
-
PDFs and other text documents
-
Open-ended survey responses
-
Blog posts and other web pages
-
Social media posts and interactions
-
Online reviews
-
Call center recordings and transcripts
-
Audio, image, and video files
-
Online chat threads
-
Slideshow presentations
-
Data from internet-of-things (IoT) sensors
While unstructured data might be challenging to unravel, it can be a treasure trove of useful, actionable insights with the right tools and technologies:
-
Deepen knowledge about customers. Virtual stacks of customer emails asking for help, online reviews, conversations with chatbots, and survey responses contain valuable information such as product preferences and brand expectations.
-
Highlight market gaps sooner. Often, customer complaints and suggestions contained in unstructured data point to unmet needs that your enterprise should address.
-
Improve customer service. To give an example, enterprises can utilize metadata to learn their customers’ preferred modes of interaction (e.g., via call center agents, email, social media chatbots, face-to-face conversations) and optimize these to enhance customer experience.
The purpose of data and analytics solutions and services is to turn data into business value, whether it’s structured or unstructured. Your enterprise can ramp this up by implementing the following:
Analytics use case prioritization
Data science use cases are real-world concerns to be addressed using data that’s already available. Perhaps the company has factory sensor data that can be used to predict machine failure, or maybe it has energy consumption data that can be used to reduce carbon emissions. When a use case is tackled, it might have a particular impact on the business, such as reducing costs, increasing product quality, and enhancing supply chain efficiencies. By projecting how much impact each use case could have on the business, decision-makers and managers can set the order in which they want to take on use cases. The development of business applications thus becomes more effective. In fact, Gartner projects that by 2024, businesses that utilize data and analytics to inform app development will outperform competitors.
Augmented analytics
Often, the output provided by data and analytics tools aren’t immediately usable by staff members who lack data literacy or analytics skills. Even if end users are data literate, the overwhelming amount of data they must parse leads to excess time and effort spent on analyzing data, assigning relevance to it, and looking for data that point to existing or fomenting business problems.
Augmented analytics can address these limitations by easing and enriching the interactions between human employees and data processed or managed by AI or machine learning. Lingaro’s Intelligent Insights, for instance, has capabilities in self-service analytics and generative AI that help consolidate layers of data to relay business insights in plain, natural language so that stakeholders can immediately act upon them and make timely decisions. The tool can also reference deep historical data to highlight significant anomalies and identify troubling or promising trends, plus rank those anomalies and trends by business relevance.
Data enablement
Sometimes, data and analytics tools become virtual paperweights because the staff who might benefit the most from these tools don’t use them. According to a Gartner survey, staff might resist adopting data and analytics because it fundamentally changes how they do things. Moreover, their lack of analytics skills also keeps them from using the tools. Therefore, when assessing data and analytics vendors, always make it a point to ask how they plan to ensure that people use their tools.
Data as a product
Some of the most pressing challenges with managing data are the following:
-
Difficulties in searching, understanding, and accessing data disrupt the discovery of new use cases.
-
Lack of clear data owners results in inefficient utilization of data.
-
The high level of effort required to implement data governance upon all business units of the entire enterprise makes organizations do without it.
Organizations can address these challenges by treating data like a consumer product. What does this mean, exactly?
First, just like how consumer products have target consumers, data can also have defined users. This means that the data provided to particular users — along with the insights derived from the data — is presented in a manner that is geared toward those users. These users, in turn, will find it much easier to discover and address use cases.
Second, from the producer’s side, consumer products have product and brand managers who handle tasks such as product development and marketing. In the same manner, data can also have "data owners” who’ll exercise responsibility over it. That is, they decide where data is stored, who can access it, and what people can do with the data.
Third, producers have distinct product divisions which are managed separately while still governed by centrally determined policies. Similarly, when it comes to data governance, the data owners — the leaders who have more intimate knowledge of their team’s particular needs — may implement their own internal policies and standards on top of centrally defined ones. Distributing the weight of data governance via a data mesh is more time-efficient than having a centralized body govern everything.
Data marketplace
A data marketplace is a customizable platform where data consumers and data producers meet. It’s comparable to Amazon, where everyone shops for everything. The data marketplace has many data product categories, such as sales data, training videos, and accounting reports. Unlike oversimplistic folder directories, each category has descriptions so that users will have an idea as to what type of data the category contains. By treating data like products and making these available in a data marketplace, everyone in the enterprise should have a much easier time discovering and utilizing data in their day-to-day tasks. For example, Lingaro has developed a data marketplace app that can be embedded in Microsoft Teams, a tool that employees already use every day. The app helps consolidate the number of interfaces that data consumers use by letting them access the data they need via Teams. At the same time, data producers can use the app to add attributes and descriptions to their data products.
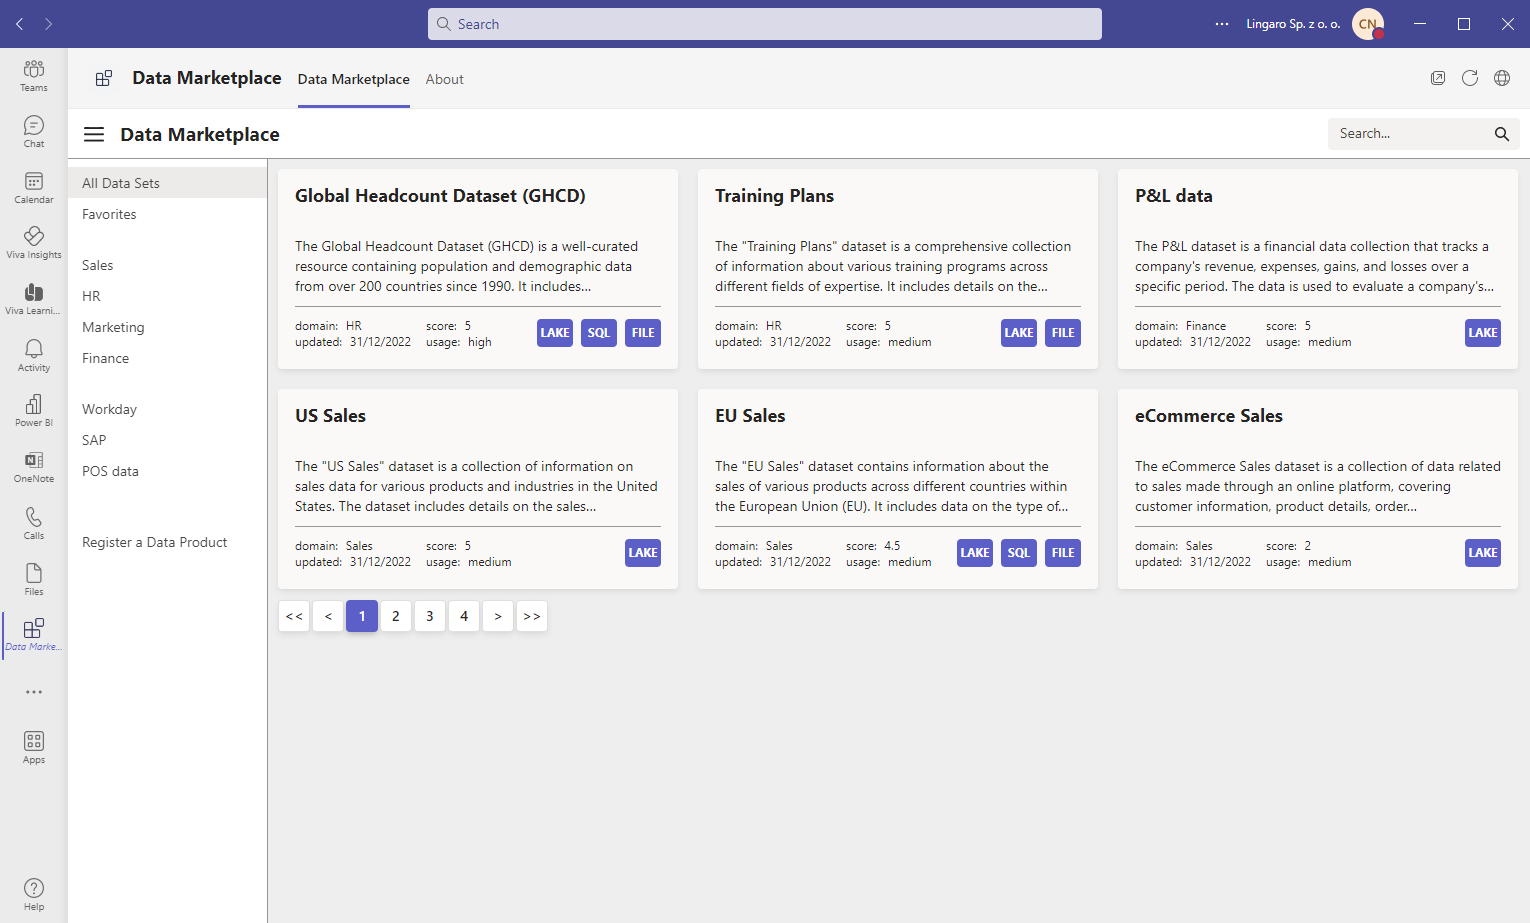
Figure 1. A sample screen of Lingaro’s data marketplace app in Teams showing different kinds of data
Consumers just need to go to one place — the data marketplace — to get the data that they need. This means that they don’t have to interact with too many interfaces to do what they have to do with data.
Data producers, on the other hand, offer their data products to consumers and help the latter discover, understand, and utilize their products. Just like how consumer products sold online have product information pages, so, too, will data products, in the form of information pages. Specifically, these pages will contain information such as who the data owners of the datasets are, brief descriptions about the data they contain, and guides on how to use the data.
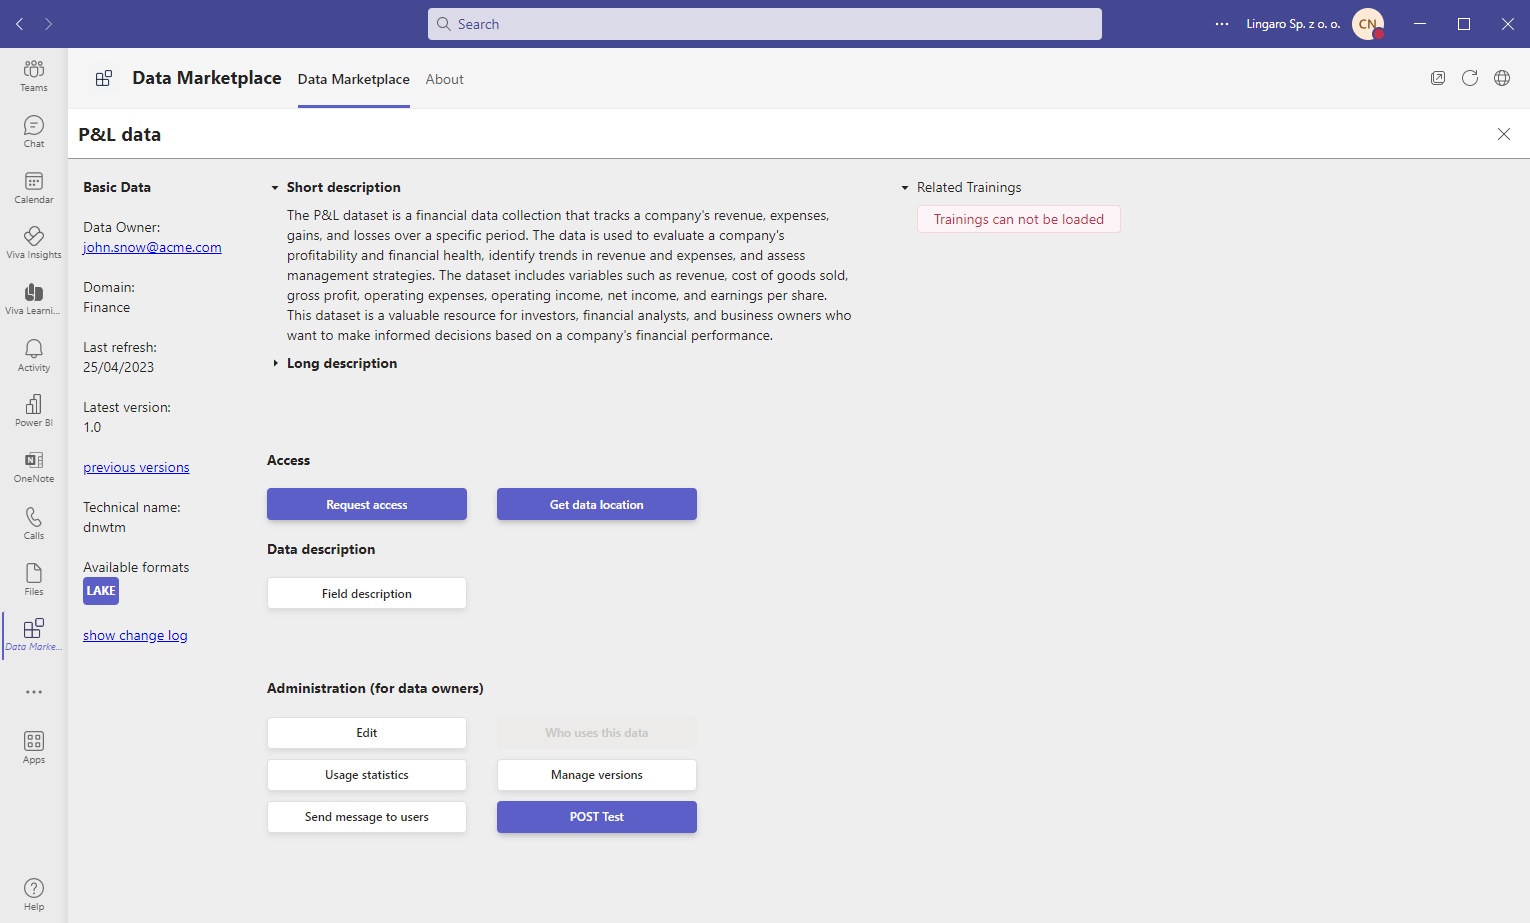
Figure 2. A sample screen of Lingaro’s data marketplace app in Teams showing descriptions and other relevant information about the data
Beyond just providing organizations with data services and solutions, Lingaro also provides support in the form of adoption and awareness programs. By designing and delivering these programs, we empower everyone across the organization to create or add business value in using data marketplaces, like Lingaro’s.
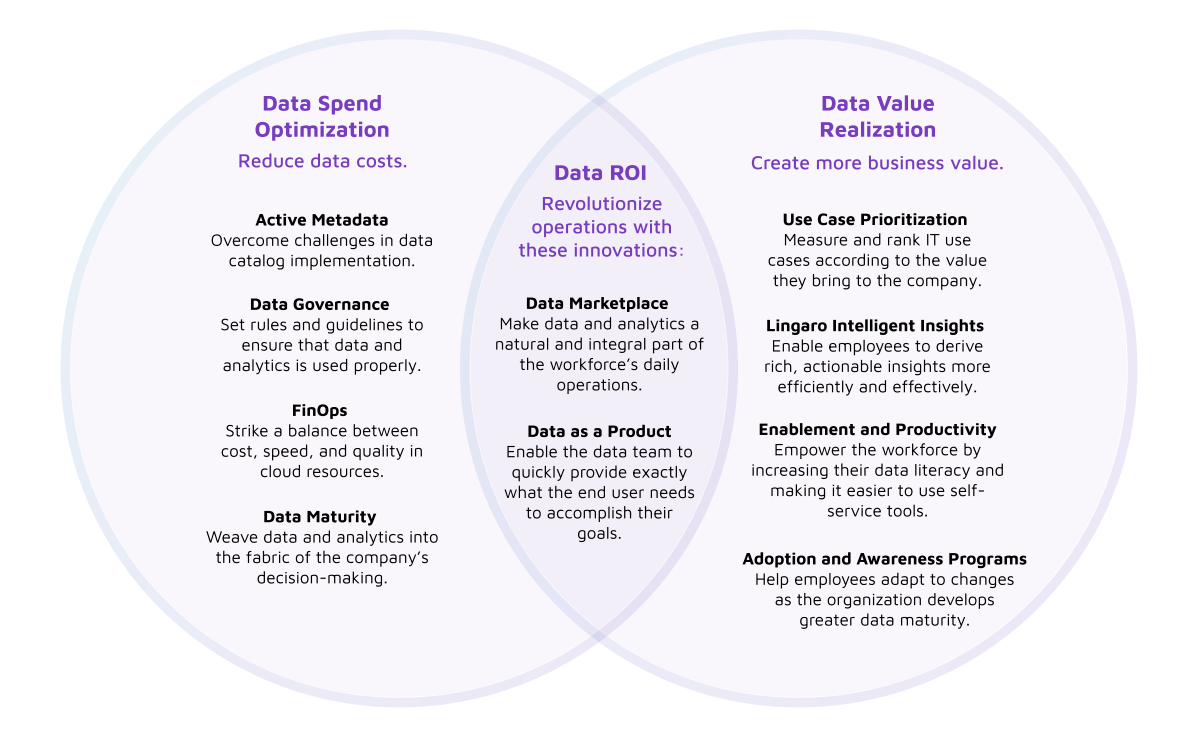
Figure 3. A sample visualization of data services and solutions of Lingaro’s technology consulting practice
Realizing the full business value from data and analytics
To summarize, your enterprise can achieve data ROI and create or add further business value from data and analytics by:
-
Prioritizing analytics use cases according to business impact.
-
Utilizing augmented analytics to process overwhelming amounts of data and arrive at actionable insights faster.
-
Treating data like a consumer product to make it easier to manage.
-
Placing data in a data marketplace to make data more discoverable and usable.
Lingaro’s technology consulting practice develops and implements end-to-end data strategies that bridge business outcomes and practical, technological solutions — from data maturity assessments and 360-degree analytics diagnostics to data investment road map. Lingaro’s technology independence and use case approach enable organizations to orchestrate tools and modern technologies around business needs while figuring data governance as well as cloud platforms and costs into the equation.
Read more articles on Data ROI:
Data ROI: Challenges and Opportunities
Data ROI: How to Optimize Data Spend