


In one of my last articles I wrote about the two-sided challenge companies face today in ensuring that data is available to all employees and, delivering tools which make it easy to extract value from this data. Together, these goals make up the core pillars of what is commonly known as data democratization.
Today, it is increasingly hard to get data democratization right. On the one hand, the Big Data ecosystem is growing larger, more complex, and redundant with data from multiple sources flowing to diverse storage locations.
And on the other hand, it is tough to find tools which naturally fit in with users’ day-to-day workflow. These tools should be very easy and intuitive to use so employees can begin using them to visualize and analyze data with almost no training.
Why? Because most employees aren’t focused exclusively on data science. But their job effectiveness is what data science actually benefits – and they are in the best position to explore data-driven opportunities from the ground up. This situation creates what I think of as a “Data Democratization Bottleneck.” Let me explain.
Real-world organizations are full of excellent – but resource-crunched – data science opportunity spotters.
You can probably think of one business question for which an answer, assuming you could extract it from your organization’s data, would help you do your job better or maybe even get a promotion.
So what’s stopping you from chasing that answer?
If you’re like me, it has traditionally been limited resources causing this “bottleneck.” Especially if it wasn’t clear that you could get the right data, let alone extract an answer from it, how could you justify spending a lot of time working on it? And asking a colleague for help on such a large, relatively undefined project? Forget it. People have jobs to do.
That’s not to say the opportunity isn’t there, though. Who knows? The idea you spotted at the grassroots level might grow into millions of dollars in process optimization savings, for example. But you simply can’t spend months working on it.
The solution is a self-service analytics tool that allows everyone in an organization to get fast, data-driven answers.
That way, instead of spending a few months on a data-driven answer to a business question, any employee can get it in just a few hours. If the answer is actionable and translates into value, great. If not, no significant amount of time was wasted. There’s no time lag associated with getting trained up, figuring out how to assemble data, or asking for (and receiving) IT and technical support before finally making a conclusion.
This idea of getting fast, intelligent answers is nice – and far from new. Many so-called self-service BI tools are advertised with the promise of providing just such a data experience to organizations.
Few actually deliver, though, and instead get bogged down in technical features and details that the average user doesn’t care about and, frankly, shouldn’t need to care about. Employees are there to get their jobs done by finding answers to business questions, making timely decisions, and taking appropriate action. The moment a tool slows things down by being too complex or requiring training, it will stop being used.
So, what’s the best way to find a tool that does deliver the real-world capabilities that organizations need? Nothing beats putting it up against a real-world business question.
The question: how to optimize our LinkedIn presence?
If you follow Lingaro on LinkedIn (or if you don’t, it’s a good time to start!) you might have noticed our increased activity over the last few months. Why? Well, we’re aware of the importance that social media channels have nowadays, and we knew it was necessary to get more active. Just like you, we can’t afford not to.
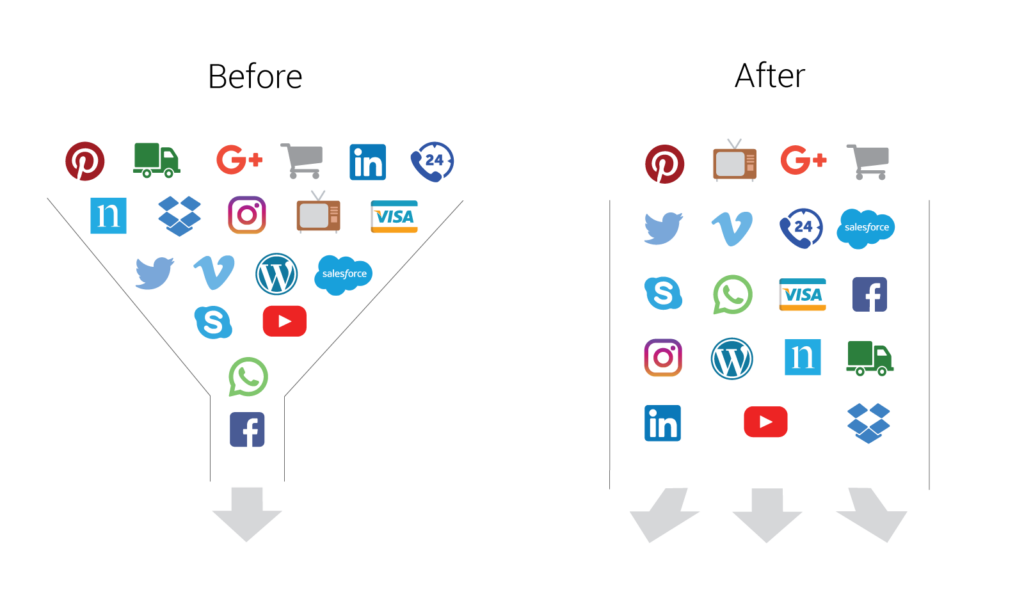
But it’s not a matter of activity alone. You need to stand out in the crowded place that LinkedIn has become, where posts and articles are published every second.
Making the most of LinkedIn therefore requires answering many key questions before you take the appropriate actions and decisions. You have to consider things like:
-
What content would represent your company effectively? In other words, what would be relevant and interesting?
-
How often should you publish? If you publish too much content, users will treat it as spam. If you are not active enough, you will remain unnoticed.
-
And even if you get the frequency right, the next question is the quality of the content. Will your followers like it? Will they share it and bring in new followers?
LinkedIn has a built-in Company Page Analytics solution that can help you start answering some of these types of questions. It allows you to visualize key metrics such as engagement, number of likes, followers, clicks, and impressions over a given time period.
These built-in analytics are a great place to start, but as Alberto Cairo correctly points out in his great book about visualizations and infographics, The Truthful Art, “finding the right answers to good questions makes us capable of posing even better and more profound ones.”
That means once you become familiar with LinkedIn Company Page Analytics, it probably won’t be enough. You’ll eventually want to dig deeper into your profile activity and create custom visualizations.
I was at this point when I decided to leverage LinkedIn’s open API and connect our data to a visualization tool and start building my own insights. I evaluated several tools to help me do so, and Domo was the clearly the best choice.
Domo’s winning combination: one person, one tool, one morning.
Of all the tools I evaluated, Domo was the only one which truly made it possible to use our LinkedIn data the way I needed to.
In matter of seconds, you can plug into the many different sources of data offered by Domo’s LinkedIn connector.
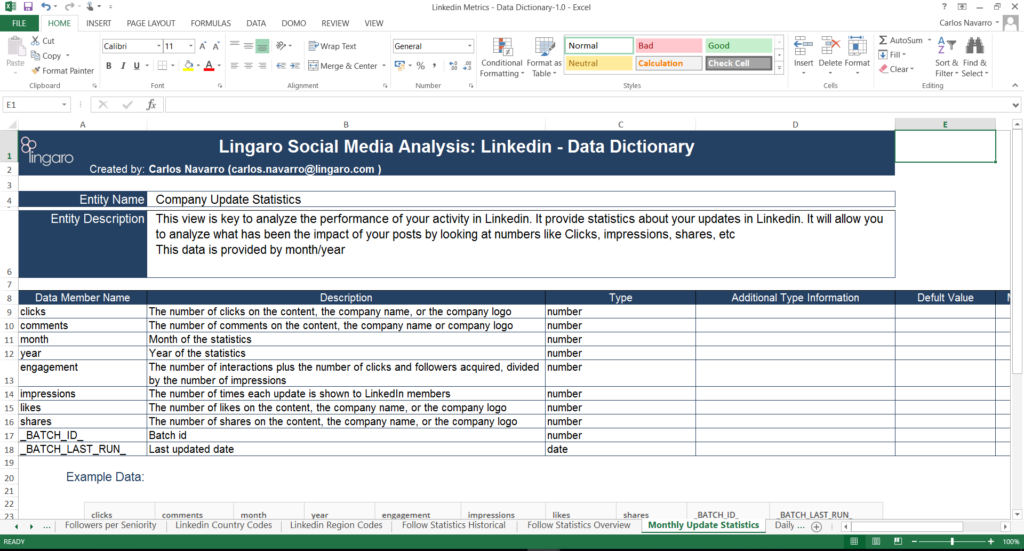
If you aren’t an advanced user of LinkedIn yet, you might find it useful to create a data dictionary with all the definitions of the metrics. (I know I found it valuable – it also helped me self-educate on some of the terms LinkedIn uses like “engagement” and “impressions” which I hadn’t been that familiar with before.) Or better yet, just ask me for a copy of the data dictionary I prepared! I’m happy to share it.
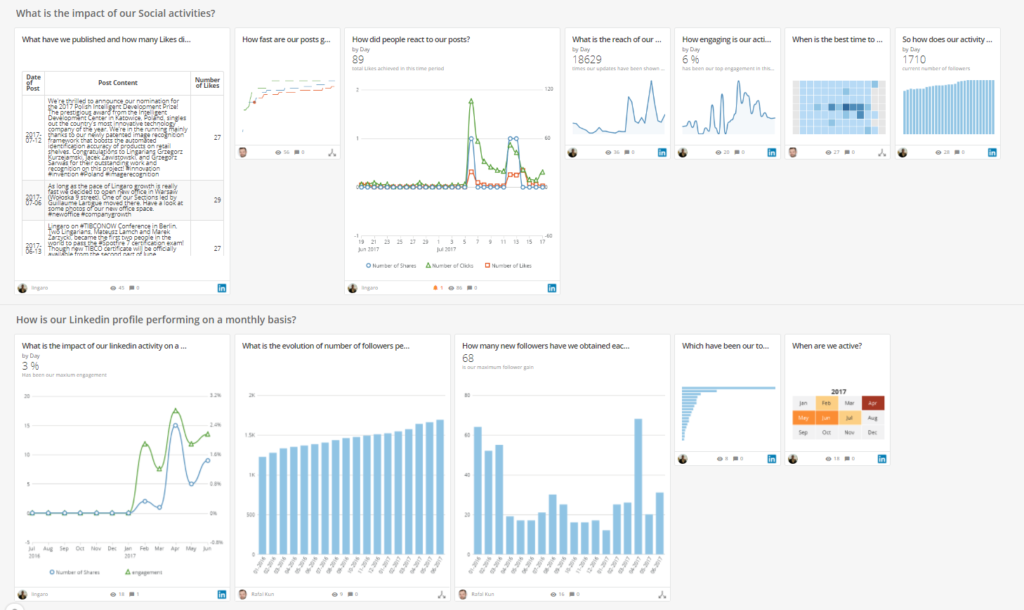
As with any analytics tool, preparing data is 80% of your total work. So after using the connector and understanding the data, you’re on the home stretch. Next comes the fun part: building your data visualizations, referred to as Cards in Domo.
Here is where you can develop visual answers to all your questions. With Domo, doing so is extremely easy and there is a huge variety of visual layouts to choose from. Once you create your Cards, you can group them into Collections, which you can then bring together into a single Page for all your LinkedIn insights.
Finally, you can build alerts to signal when LinkedIn engagement goes up. In my case, I scheduled reporting every day at 9am. You can get regular updates like that with most tools, but with Domo it is possible to set them up completely on your own, without any training or help.
Total time required: 1 morning.
Domo delivered a huge return on time invested in answering this question.
What can you really expect from devoting only one morning to something?
With Domo, quite a lot, actually!
I was able to draw three key conclusions that will help shape our LinkedIn strategy:
-
We get the best results from short, infrequent posts focused on our company. We should publish no more than twice a week, ideally only once, and cover topics related to employees, news, awards, etc. Longer posts on other topics haven’t driven as much engagement.
-
We are attracting new followers, but the competition is attracting more. I knew we were doing reasonably well, but now I see we’ve got a lot of room for improvement.
-
We need to make sure our company’s most influential LinkedIn users like each of our posts. We get significant attention and engagement in posts referencing our new COO, Malgorzata Gryz, who has more LinkedIn followers than anyone else in the company. That’s why it will be a good idea, I think, to identify other team members with significant followings and get them involved as well.
Moving forward, our primary goal will therefore be to take a “quality over quantity” approach to LinkedIn content. We’ll aim to deliver a few high-engagement posts that provide the most bang for our buck, i.e. posts that don’t take as much time to prepare but result in high engagement.
Domo enables a realistic approach to data-driven problem solving in a real-world organization.
In summary, I think Domo provides two key value-adds for everyday business users:
-
Ease of use. It is cloud-based and allows anyone in the organization to access data with wizard-driven connectivity, prepare it, and visualize it through a well-designed, intuitive interface. You can share your work across your business so that everyone can get involved and use it to help accelerate growth.
-
Powerful capabilities. It has an impressive, unique set of over 500 connectors designed to access all your data from any source and bring it together into one place. You can then set up regular alerts to get to the bottom of data stories as they unfold.
Those are the main reasons we’re going to continue using Domo to optimize our LinkedIn posts. Make sure you’re following us to watch our progress!
And if you’d like to see just how fast Domo can get your business questions answered, feel free to send them our way. Or simply ask for a demo. At Lingaro, we see the unique value Domo can deliver and recently became official partners.


