Insights
Trending Topics
Industry and Data Insights
Data Visualization, Data Platforms

How Generative AI Will Transform Data Management and Visualization
In 2024, data will be more conversational. Augmented by generative AI, data platforms and data visualization tools will transform data into a...
Read more about How Generative AI Will Transform Data Management and VisualizationData Visualization

Power BI Premium Gen2 vs. Azure Analysis Services: Which Is Better?
Organizations that have only explored or just started using data and analytics as well as reporting solutions such as Power BI at might need to...
Read more about Power BI Premium Gen2 vs. Azure Analysis Services: Which Is Better?Supply Chain, Data Visualization

Supply Chain Management With Power BI: Data-Driven Use Cases
Business intelligence and analytics can help decision-makers better manage their organization’s supply chain by visualizing data to be actionable and...
Read more about Supply Chain Management With Power BI: Data-Driven Use CasesData Visualization

Data Visualization 101: Use a Power BI Gantt Chart to Manage Projects
They say a picture speaks more than a thousand words. That’s mostly true in any business — especially when you’re in project management data...
Read more about Data Visualization 101: Use a Power BI Gantt Chart to Manage ProjectsNewsroom, Data Visualization

Custom Power BI Visuals. Interview with Kamila Czuchraniuk
With a growing interest in custom visuals, Lingaro custom Power BI specialists step in to support business users in their everyday tasks with free...
Read more about Custom Power BI Visuals. Interview with Kamila CzuchraniukData Visualization, Case Studies

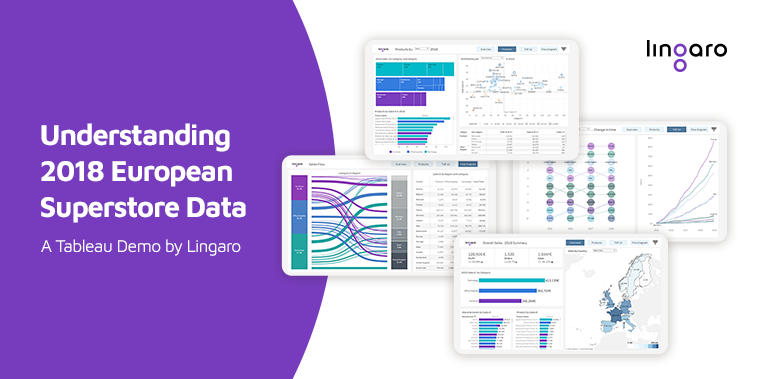
A Case Study on Using European Superstore Data in Tableau
Tableau is one of the most powerful data visualization tools on the market. See its possibilities in a demo presentation we have put together using...
Read more about A Case Study on Using European Superstore Data in TableauData Visualization

How to Encourage Your Team To Use Business Intelligence Tools Every...
Usually, Business Intelligence tools is implemented at the company level. However, in order to provide real added value for a company, Business...
Read more about How to Encourage Your Team To Use Business Intelligence Tools Every...Data Visualization

The Impact of Business Intelligence Tools on Employee Engagement and...
Among the most difficult challenges companies face are slow decision-making processes. They may become even more daunting as they scale up and expand...
Read more about The Impact of Business Intelligence Tools on Employee Engagement and...Data Visualization

The Real-World Data Democratization Bottleneck – And How Domo Fixes It
In one of my last articles I wrote about the two-sided challenge companies face today in ensuring that data is available to all employees and,...
Read more about The Real-World Data Democratization Bottleneck – And How Domo Fixes Itto Top


