On the shop floor, various OT/IT systems, machineries, equipment, and people generate data that can track how effective and efficient manufacturing processes are. For example, tracking machine operating temperature can determine impact on product quality and defects as well as what axial vibration levels must be avoided to prevent machine breakdown. In this article, we’ll show how manufacturing data can be used to optimize manufacturing processes and reduce COGS.
According to Gartner research, 80% of CEOs across different industries are investing more in digital technologies to promote growth, optimize costs, and digitally transform. This can be clearly seen in manufacturing, as reflected by the fourth industrial revolution or Industry 4.0. It features manufacturers that can turn the everyday data they generate into actionable insights for streamlining their processes. To illustrate, quality control directors can use data and analytics to make it easier for them to identify and address the root causes of product defects, whereas operations directors can use data and analytics to make it easier to identify and address inefficiencies in manufacturing processes.
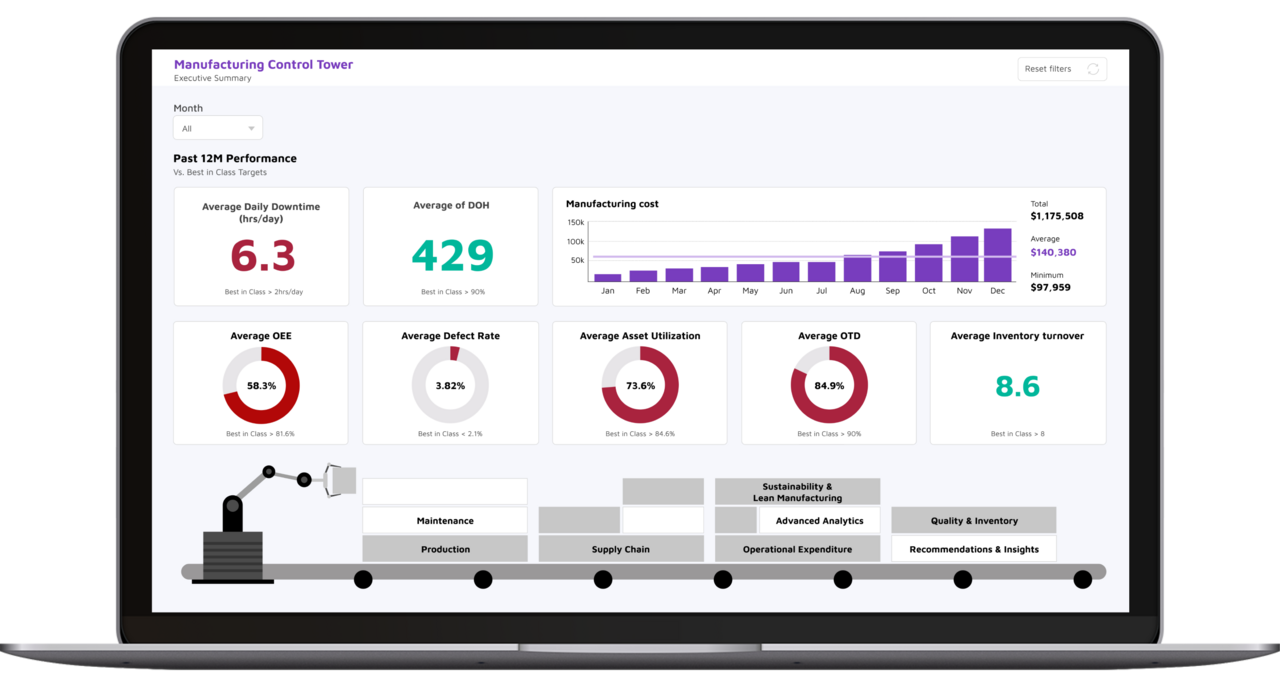
Figure 1. A manufacturing executive summary dashboard featuring manufacturing KPIs
Lingaro, a trusted partner in digital manufacturing, stands at the forefront of digital transformation. In this article, we’ll show how manufacturing data can be transformed via digital technologies such as internet of things (IoT), generative AI, and digital twin for production line performance modeling and simulation to enable capabilities like real-time monitoring, predictive maintenance, smart supply chains, and what-if scenario planning. They use these to iron out inefficiencies to minimize costs and maximize productivity.
With that in mind, let’s take a look at data in action.
Using data and analytics to improve overall equipment effectiveness
Processing the data used to calculate manufacturing KPIs leads to all sorts of actionable insights for improving manufacturing processes. To illustrate this, consider overall equipment effectiveness (OEE) — an indicator of manufacturing efficiency that takes into account everything that reduces productivity. It is calculated by multiplying three factors:
-
Availability: How much time equipment was actually running versus planned production time
-
Performance: Ratio of actual production speed to ideal run rate
-
Quality: How well manufacturing processes produce output that meets quality standards
Measuring these three factors can be done by utilizing equipment with built-in trackers or fitting machines with IoT sensors. This way, shop floor managers can quickly find inefficient machines with pinpoint accuracy. Furthermore, by modeling data through machine learning models, operations managers can find production issues that they need to address. For instance, the additional strain put on machines as they’re made to produce more output will likely result in a proportional decrease in OEE, as can be seen in Figure 1 below, but a sharper-than-normal decrease will be a cause for concern.
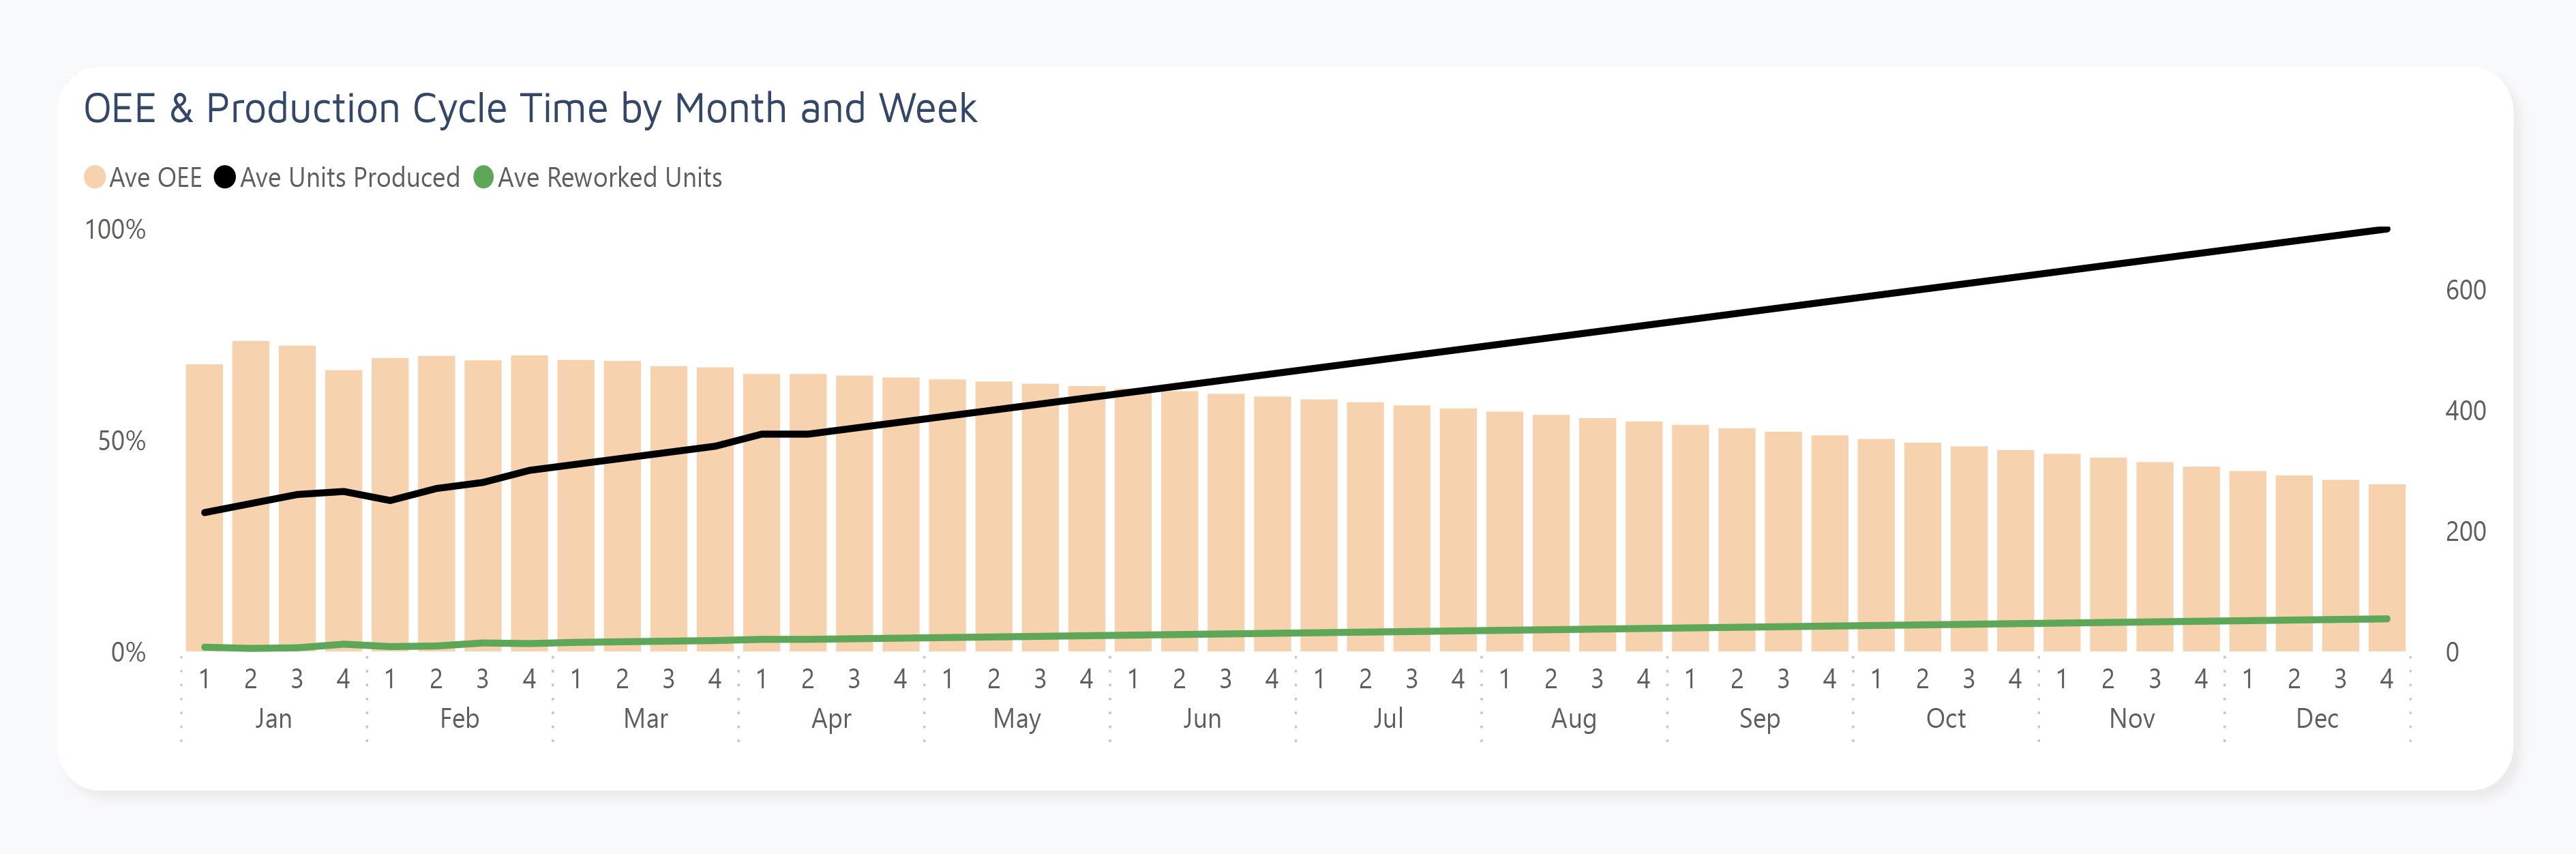
Figure 2. A compound chart showing the evolution of average OEE, average units produced, and average reworked units over the course of a year
On a strategic level, operations directors can consider If increasing output levels is worth the costs related with lower OEE, and if they need their shop floor managers to initiate efforts to improve OEE.
Given that managers can gather and process data on machine performance, maintenance, and output quality, they can then use generative AI, for instance, to create optimal repair and maintenance schedules to proactively prevent machine breakdowns and extend equipment lifespans. Furthermore, if they’re able to get data at a certain level of detail and identify how factors behave with one another, they can create a digital twin of the production line. This can be used to explore ideal process sequencing, changeovers, and operation patterns involving idling and average optimal line speeds. All of these can be used to determine proper machine operation.
Here are other specific ways in which data-driven insights streamline processes and improve KPIs:
|
KPIs |
Data Collected/ |
Manufacturing Process Streamlined |
Benefits to the Enterprise |
|
|
Equipment maintenance is transformed from being reactive to being timely and proactive via the following:
Machine operation is made more efficient via the following:
Identification of product quality issues happens earlier rather than later. |
|
|
|
Eliminated paperwork reduces risk of costly human error. Integrated systems make shop floor data immediately available to decision-makers Manufacturing aspects of supply chain management are enhanced:
|
|
|
|
|
|
accident rate |
|
Proactive equipment maintenance and improved compliance result in incident prevention. |
Safer working environment for employees |
Table 1. Samples of data that can be tracked and analyzed to streamline manufacturing processes
Another example is manufacturing waste — specifically, leftover materials that did not become part of the final product. This includes sawdust, metal shavings, spoilage, used chemicals, rejected work in progress, and final products that do not meet specifications and cannot be reworked.
IoT devices can accurately capture production data at the machine level. This data can include how much waste is produced and the reasons behind it, such as improper machine setup and operator errors. Monitoring data and data from other tools like an environmental management system (EMS) can be utilized to create a waste flow map (WFM) that shows who plays a role in waste generation and where, when, how, and why waste is generated.
From this map, the quality control team can address production errors and uplift the output’s quality score. Supply chain and logistics managers can determine which specific materials sourced from particular suppliers make subpar products. Digitalization and innovation managers can develop simulations for playing out strategies for not only reducing waste, but also improving sorting to retrieve recyclable waste and reduce the need to purchase new raw materials. The operations business unit can then implement the strategies that have the best projected results and oversee continuous improvement efforts.
Enabling anomaly detection, failure prediction, and incident prevention through root cause analysis
Gathering equipment performance data from each individual machine enables all sorts of analysis. For instance, analysts and planning managers can determine root causes of production bottlenecks and inefficiencies with varying degrees of specificity depending on how much detail has been gathered.
In Figure 2 below, we can see how downtime is broken down into two sublevels of increasing granularity. Level 2 loss reasoning shows that mechanical issues, communication breakdowns, electrical issues, and inaccurate production estimates nearly equally contribute to downtime. Level 3 loss reasoning drills down further to reveal that mechanical issues are mostly due to wear and tear and lack of proper maintenance. This can quickly inform on where to focus.
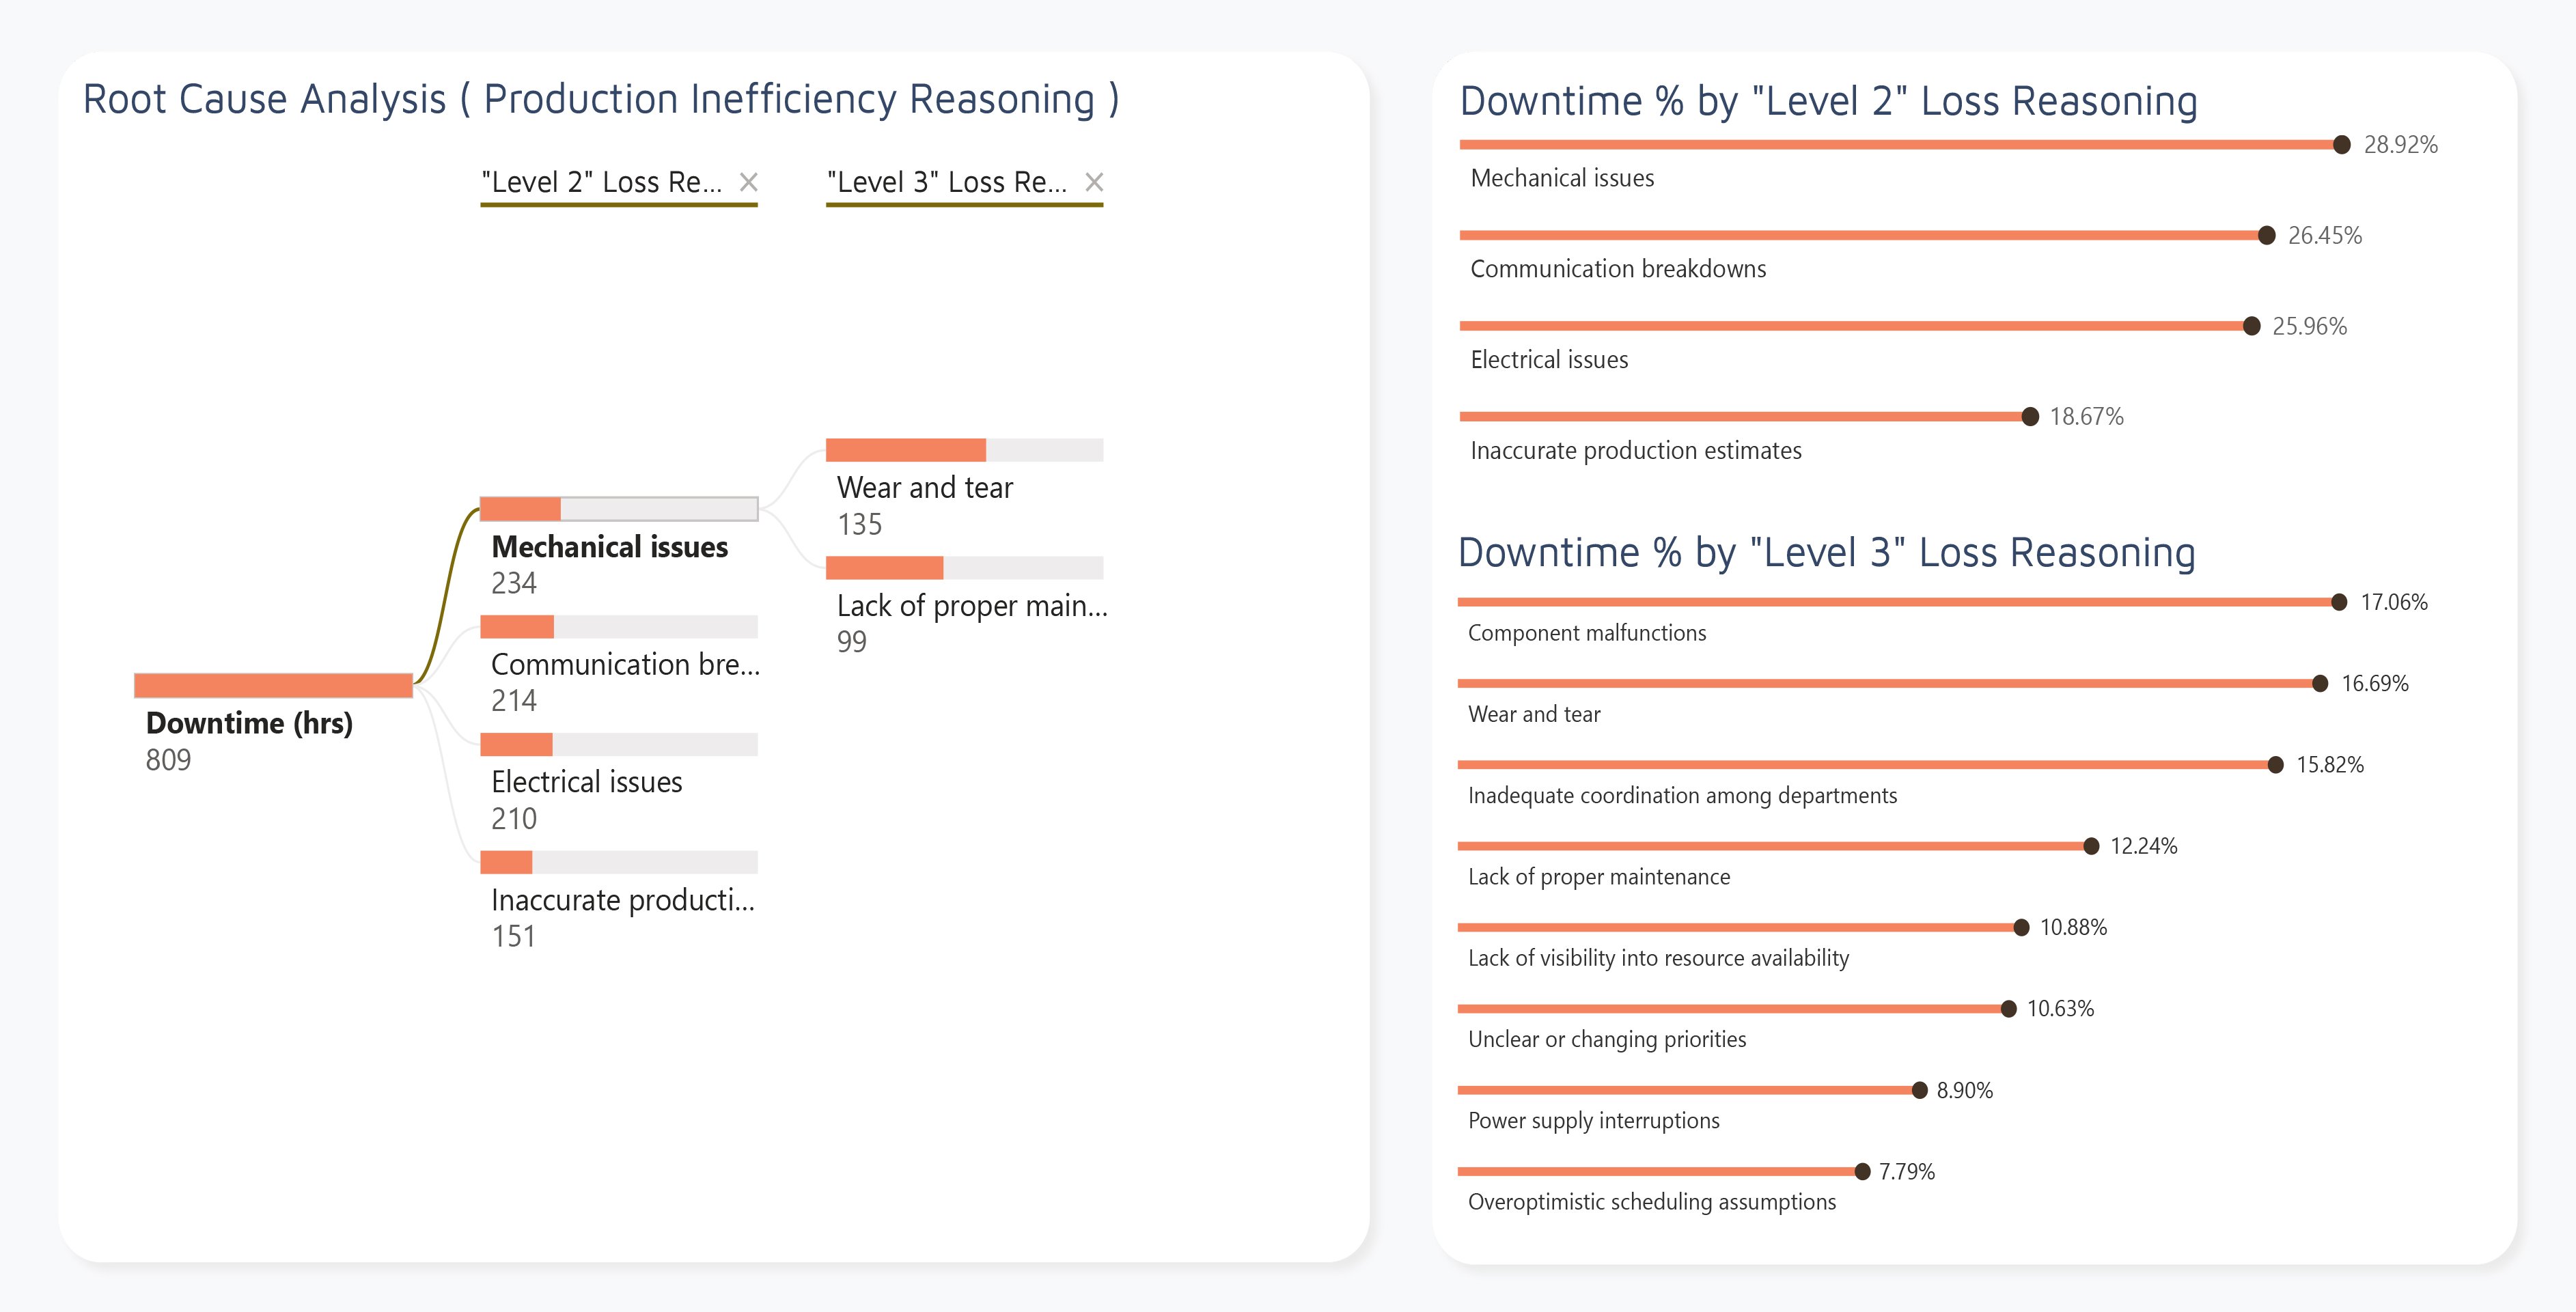
Figure 3. An example of production inefficiency root cause analysis
By addressing major losses first, decision-makers can expect to reduce more downtime hours than if they were to prioritize minor factors. Automated root cause analyses can enable quick and accurate identification of issues and could be integrated to drive advanced capabilities like anomaly detection, failure prediction, and incident prevention.
Generative AI for production planning and management
As seen in Table 1, everyday manufacturing data can be utilized to streamline manufacturing processes. More specifically, raw data can be used to train ML models that will provide predictive and prescriptive analytics to decision-makers. Generative AI, in particular, can transform vast amounts of raw manufacturing data into meaningful and actionable insights for strategic and operational decision-making. This is exhibited in four ways:
-
Automated and targeted reporting: Generative AI for manufacturing can automatically generate detailed, coherent, and insightful reports that are targeted for specific audiences. For example, quality control directors can receive reports on product quality metrics, quality standards and regulations compliance, and progress on quality enhancement initiatives.
-
Predictive analytics: Trends in historical and real-time manufacturing data can be used to forecast production KPIs, which are useful for production planning. Machine performance metrics can also be used for predictive maintenance and prevention of process failures and safety incidents.
-
Custom alerts and recommendations: When issues like sudden machine breakdowns or supply blockages arise, generative AI can create timely, context-aware alerts and suggestions that give operators and managers options for immediate corrective action. For example, if the supply of a certain raw material will arrive late, generative AI can come up with process reconfigurations so that the shop floor can be as optimized as possible given the new circumstances.
-
Synthetic scenario creation: Generative AI for manufacturing can create realistic what-if scenarios for crafting flexible and effective production plans.
Synthetic scenario creation is especially useful for solving complex problems such as increasing capacity utilization, reducing unplanned downtime, and keeping production on schedule. Consider on-time delivery (OTD): According to industry experts, manufacturers must have at least a 95% OTD rate to compete with leading companies and meet the fulfillment requirements of big-box stores like Walmart. To achieve this, they must do efficient and effective production planning. By quickly synthesizing production scenarios with diverse conditions, decision-makers can significantly reduce the time they need to analyze problematic situations, increase their chances of making correct decisions, and increase how much they get done whenever they do production planning sessions.
Digital twin for production line simulation helps determine process enhancements that have the best outcomes
Data can also be utilized to create and experiment with different production-enhancing strategies without disturbing actual production. By amassing data of sufficient scope and detail and mapping the causal relationships of different manufacturing inputs and conditions, data scientists and engineers can create a virtual representation of the production line, called a digital twin. It accurately and comprehensively incorporates parameters such as thermodynamic conditions, machinery configurations, and variable behavior correlations to become a true reflection of production. This simulation can be integrated with real-time monitoring data so that production issues can be addressed more quickly, but its true value lies in experimentation.
To exemplify, production planners can try out all sorts of resource allocation strategies by using what-if scenario planning. It allows planners to simulate different production scenarios by changing one or more production variables. For instance, they could see how output predictions would change if they increased asset utilization.
Simulating scenarios makes experimenting with new production planning and scheduling strategies simpler and more economical because it eliminates the need to divert time and resources from production. Moreover, it helps identify strategies with the greatest likelihood of success, making it much more effective at enhancing production line efficiency.
How Lingaro can enhance operations, quality control, and supply chain and logistics
As a leading player in the space of digital manufacturing, Lingaro has what manufacturers need to turn raw data into everything they need to streamline processes:
-
Manufacturing operations dashboard and control tower
-
BI-powered tools for predictive maintenance and equipment management
-
Production volume forecasts per line
-
KPI tracking and forecasting per line
-
Scheduling process optimization
-
Line changeover strategies and recommendations
-
Resource allocation insights and recommendations
-
Efficiency reports and what-if simulations
-
Disruption, anomaly detection, and risk alerts
-
Performance and inefficiency detection reports
To compete in Industry 4.0, enterprises need to be able to harness their own manufacturing data. However, given how immense in scope and how critical the business’s digital transformation is, it’s understandably difficult to determine where to begin.
One good place to start is by ascertaining the manufacturing data maturity level of the company. Simply put, manufacturing data maturity is a gauge for how well a manufacturer can transform data into business value. To help enterprises find where they stand on the maturity scale, we’ve come up with a free and easy-to-use calculator, which can help determine the enterprise’s maturity level and provide recommendations on how it can be uplifted.