


Data surrounds us, especially in the business environment. Almost every aspect of a company can be quantified and analyzed, starting from workers’ productivity to electric power consumption. Doing so requires not only storing data but also visualizing it, which is a significant challenge for a vast number of modern companies.
In 2015, only 17% of surveyed companies were adopting Big Data analytics, while now far more than 50% have. Moreover, McKinsey’s 2018 report showed that there is already a race to adopt Artificial Intelligence (AI) in multiple economic sectors (Fig. 1). AI algorithms are nowadays a cutting-edge technology for data analysis and visualization.
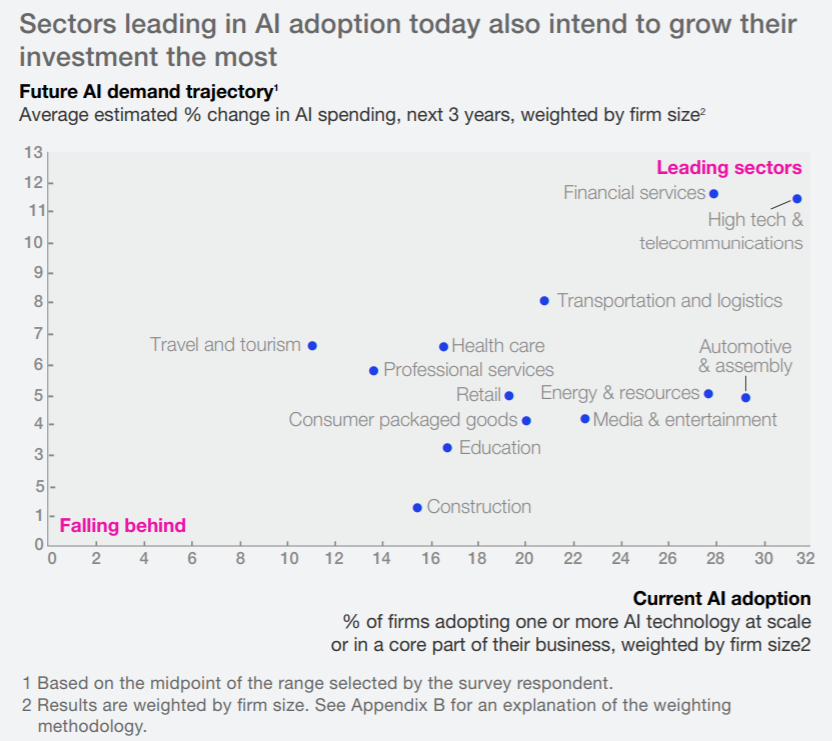
Figure 1. The percentage of business sectors currently adopting AI technology (horizontal axis) and the average estimated % change in AI spending over the next 3 years (vertical axis). Source: McKinsey Global Institute AI adoption and use survey; McKinsey Global Institute analysis
Here I will describe Data Visualisation trends which are evident now in most data analytics tools. Under the umbrella term ‘Data Visualisation’ [DV] I will place a whole spectrum of phenomena, from bimodal IT management through augmented analytics to the embedding and multi-system DV implementation and accessibility.
Modern Data Visualisation trends primarily involve speed and ease of automation, user-friendliness, performance, and storytelling capabilities. Modern Business Intelligence [BI] tools add an interesting twist to old strategies. Let’s take a look.
Top 10 trends
1. User-friendliness for business – passé Bimodal IT system replaced by Modern BI
Modern BI allows combinng the well known bimodal IT system into a single tool. The bimodal system’s first mode is a strategy of analyzing well-understood and predictable areas and data that is stable and is — or may be easily — structured. Its second mode is an exploration of various areas of uncertainty and usually starts with a hypothesis that is later tested and verified. Therefore, taken together, these modes allow for an evolution from predictable products and technologies to innovative ones.
The bimodal IT system has been widespread in leading companies since 2016. However, it lacks an important element that would make it even more effective: user-friendliness. This is the point when modern BI enters the scene. Modern BI merges the two modes into one tool, making business reporting and visualization available for all users – even those with only basic skills. It has the features of data preparation, modelling, and interactive visualization.
This self-service has an important outcome: it makes business users more skilled in data analysis and visualization, without the need to overstrain the time of advanced Data Scientists. Businesses may now increase the number of employees knowledgeable in data analytics without investing in extensive training or hiring new data engineers. BI tools are becoming more user-friendly thanks to the augmented analytics described below.
2. Augmented analytics [AA]
This type of analytics, growing in popularity for a few years now, offers improvements and automation that are implemented with the help of advanced Machine Learning [ML] algorithms. Two years ago, Gartner called augmented analytics the future of Data Science in business. Data, by itself, is useless for businesses if there are no skilled employees ready to engage in processing it, modelling it, and preparing reports with it. However, when these employees do exist, they often lack the general overview of the company’s needs and goals. Therefore, augmented analytics will enable automated querying and include natural-language queries and narration, data preparation, analytics and visual data discovery.
Gartner predicted that by 2020, 50% of analytical queries will be generated by natural language search, or automatically, and not by queries in raw code. Moreover, Gartner analysis says that companies will significantly increase adoption of natural language processing from 35% to 50% of employees being ready and eager to use it. This number supposedly includes front-office workers. It should be noted that augmented analytics involves not only text, image and sentiment analysis but also identification of segments, clusters, groups, correlations and anomalies in data. All this makes that tool highly useful for end users in various businesses.
3. Natural Language Processing
One of the main tools of augmented analytics is Natural Language Processing [NLP], which is used to access data in a more natural way compared to writing queries in programming code or drag-and-dropping analytics and visualization modules. NLP combined with augmented analytics enables searching databases and formulating queries in natural language, sometimes even in audio form.
Thus, we may ask the system “show me sales value in 2019” and all necessary analyses and visualizations will be carried out in the background, while the user focuses on analyzing the output and on reporting. Such queries may be obviously extended by tweaking additional parameters like “show me sales value in 2019 Q1 in XYZ department”. This adds a functionality previously reserved only for chatbots and virtual assistants.

4. Artificial Intelligence & Extended Reality
Extended Reality [XR] or Augmented Reality [AR] functionality is a very fresh addition to AA systems. It enhances data awareness and understanding, in some augmented analytics systems it even enables XR Management. Since some reports or data visualizations are based on more than two parameters or dimensions, being able to visualize them in a three-dimensional environment certainly helps. Humans are tactile creatures, so we have been yearning for palpable data manipulation capabilities since the birth of Data Science.
5. Data scalability
Database scalability in augmented analytics is a trend more popular than even that of the move from single relational databases to varied nonrelational ones. Right now the main buzzwords are data lakes and logical data warehouses. These allow additional data sources — even of unstructured nature – to be merged. But a new problem arises: such databases require processing terabytes of data. Modern BI deals with that by automating basic and advanced data cleansing and transformation processes and the identification of patterns, trends, and outliers in the data etc.
6. Data journalism – “storytelling”
With increased data literacy, business executives may ask advanced questions and query data more effectively. Modern BI tools provide the opportunity to focus on important tasks like data preparation or on management and leaving analysis to the automatic system. This saved time can be now used for asking additional, deeper questions and constructing compelling and logical stories for businesses and customers. Single visualizations are no longer as convincing when our end users and customers are more educated than ever.
7. Better visualization
Choosing the right visualization technique may be very challenging, since it is data, target, and context sensitive. Moreover, there are plenty of data visualization limitations, like presenting three-dimensional databases in a comprehensible and elegant way. BI tools sometimes provide hints on the best ways to present your data. Usually, the BI environment defaults to minimalism, so there is a trend to provide the simplest – but at the same time the most informative – visualizations adjusted to a specific dataset.
Data visualization should properly reflect decent data analysis in order to increase report quality. Therefore, choices at this final stage are of utmost importance. Moreover, such details like chart styles and color palettes should not be ignored – best practices call for optimizing them for color blind people, for example. Studies say that visualizations are not only for aesthetics; texts including them are more comprehensible and more often read and cited.

8. Mobile
Mobile apps may easily enhance a business project conducted in a BI environment, for instance by sending push notifications and alerts concerning our queries, project changes, important data summaries etc. Nowadays, we need to have constant access to an overview of our work, and phones and tablets combined with BI projects support this functionality. Customers and end users may require instant access to the newest data and analyses. Moreover, taking screenshots and drawing or creating notes and sharing these with one another is more convenient and faster on mobile devices.
The ease and increased performance of BI projects combined with interactive reports on mobile devices may improve a company’s data culture.
9. Embedding
Some BI tools can be easily embedded on a website or portal or in an application to add even more functionality to it. Thereby, data visualization may be integrated with a business app. This is often very important for customers and end users, who might prefer this kind of functionality in their products. Obviously, this integration has certain limits and not all tools can be embedded like this, but BI tools providers are increasingly committed to providing such functionalities.
10. Customer experience: community, quality, support
Performance and speed are sometimes bottlenecks for BI tools. So in order not to lose customers, such systems need decent customer service. Technical support is therefore of crucial importance, since it is often the only source of help.
Creating a community is a significant step in the direction of increasing the community’s software visibility, user satisfaction, and further development potential. Community users prepare specialist posts, blogs, videos, and guides, while companies may organize meetings, thematic conferences, and summits to create a platform for BI tools developers, users, and enthusiasts.
Therefore, customer service and creating a community around BI are two steps that facilitate user experience.
Conclusion
Arguably, modern BI Data Analysis and Data Visualization has roots in the early 21th century, but recently we have witnessed rapid, unprecedented rates of advancement in these areas. BI tools make certain convenient functionalities more accessible and powerful. Big Data, cloud services, augmented analytics, machine learning, and extended reality are all blended under the umbrella of BI.
These tools simplify data analysis and visualization, and thus leave more time for businesses to develop further models and pose more interesting questions to data instead of constantly tinkering with the basics. At the same time, data literacy is increasing and business users demand more sophisticated tools and models to query their ever expanding databases. In turn, mobile applications and facilitated storytelling add more dimensions to the narrative about data. All these increase business value for every single company.

