

.jpg?width=750&height=240&name=co2%20emissions_%20supply%20chain-1-(Compressify.io).jpg)
Carbon footprint that’s measured gets managed more responsibly. Organizations can use data and analytics to recognize their environmental impact and better understand the positive contribution of greener supply chains to their bottom line. How to reduce CO2 emissions in the Supply Chain?
Considering their overall climate impact, supply chains account for more than 90% of greenhouse gas (GHG) emissions. On average, their emissions are 5.5 times greater than a company’s own. The impact is indeed unnerving, but businesses should see it as an opportunity to make a difference. More concerted action is needed, but setting targets to reduce Scope 3 emissions is thankfully becoming a business norm. Organizations are more willing — and compelled — to adopt sustainable practices because they bring tangible benefits and create long-lasting impact.
The first step: Figure out where these emissions come from.
There are many elements in the supply chain that foment a ripple effect when a customer buys a product or service: manufacturing, shipment, distribution, and delivery, to name a few. Likewise, there’s the cycle of businesses buying materials from other companies that, in turn, purchase resources from other firms.
This is where analytics figures into the equation. All these elements become data points that organizations can look and drill down into so they can better understand their environmental footprint and explore ways to minimize it.
Spend- and activity-based approaches to calculating and reduce CO2 emissions in the supply chain
Doing one’s part for the environment means knowing where, when, and how to make a difference, and businesses can’t manage what they can’t measure.
Emissions in supply chains are typically in the GHG Protocol’s Scope 3 category. These emissions are generated by resources or assets that aren’t directly owned or controlled by the company, but nonetheless occur and have an influence in the upstream or downstream value chain. Goods and services purchased by the company, wastes produced during manufacturing or operations, and transportation for delivering products are examples. There’s a full range of emissions that are categorized and standardized by organizations like the UN, the Global Reporting Initiative, World Bank, the CDP, and World Resources Institute, which businesses can use as references for defining sustainability KPIs.
Two approaches are commonly used to calculate emissions: spend- and activity-based.
A spend-based method calculates emissions of purchased goods and services by their economic/monetary value and multiplying it by a relevant emission factor, which is usually an industry benchmark.
The emission factors are built on industry averages so they might be less granular. If someone buys a pair of sneakers, for instance, a spend-based approach will consider that an apparel was bought, but it wouldn’t gauge whether the shoes were made from polyester, nylon, pigskin suede, or kidskin leather. Another example is transportation, where emission factors are applied to the amount of money spent on each mode of business travel or transportation of goods.
A spend-based approach uses financial data that’s readily accessible, which makes it useful for weighing a product or service’s overall impact. Supplier- or resource-specific data might also be too time-consuming and arduous to crunch, and it might not always be available in the company.
An activity-based method, on the other hand, uses broader data from the company and suppliers. It has the specificity to calculate emissions that are traceable to an individual product or service. This can include the mode of transport for the shipment of goods, the number of liters and kind of fuel burnt by a truck, train, or airplane, and wattage of electricity used for running equipment to process raw materials. Emissions are calculated by multiplying the data by the activity’s emission factors.
This approach obliges organizations to have additional and detailed data, both internally and from suppliers that might not even know how much CO2 they’re emitting. Aggregating, cleansing, and analyzing data also need tools and technologies — and time — that the company might not have.
Some companies start with a spend-based approach to get a gist of their company’s emissions before refining them with more comprehensive measurements. Many organizations combine both approaches to get a broader perspective on their CO2 emissions and make holistic changes in their operations. Businesses, for instance, can break down their supply chain activities into distinct data points to understand their costs, give them context, and derive actionable insights.
For example, using trucks to deliver products might produce more tons of CO2 per kilometer. However, using airplanes to ship goods will generate more than double the CO2 that the entire truck fleet emits even if it has the littlest mileage in the company’s freight operations. Shipping products from Singapore to Manila by air might have less purchase lead time but will emit more tons of CO2 compared with sea transport. Electric freight trucks — which are gaining ground in Europe — can pull their weight in reducing CO2 emissions, but they might be too expensive (or premature) for the company to invest in. Businesses, too, can look at improving vehicle fill rates or load factors to lessen shipments and transportation costs that, in turn, reduces carbon footprint.
Organizations can compare, contrast, and visualize all these data, scenarios, and what-ifs so they can see (and adopt) sustainable alternatives that still align with business strategy.
The catalyst? A well-designed business intelligence (BI) dashboard.
Case study: A CO2 emissions dashboard for an FMCG company’s freight operations
Uncovering emission hotspots in the company’s supply chain is multifaceted. BI dashboards — when configured with the right tools and technologies — can simplify and automate this process.
That was the milestone we achieved with a multinational, fast-moving consumer goods (FMCG) company. It knew that it had to spur and speed up its sustainability initiatives. Their efforts, however commendable, were often bogged down by time-consuming, back-and-forth reporting processes with cross-functional stakeholders and manual, error-prone workflows. This was exacerbated by disparate data sources that often include inconsistent information and rely on difficult-to-analyze Excel workbooks.
Together with EcoTransIT World, a freight emissions calculation and reporting company, we built an interactive CO2 emissions dashboard to tangibly measure and track carbon footprint across the FMCG company’s freight operations.
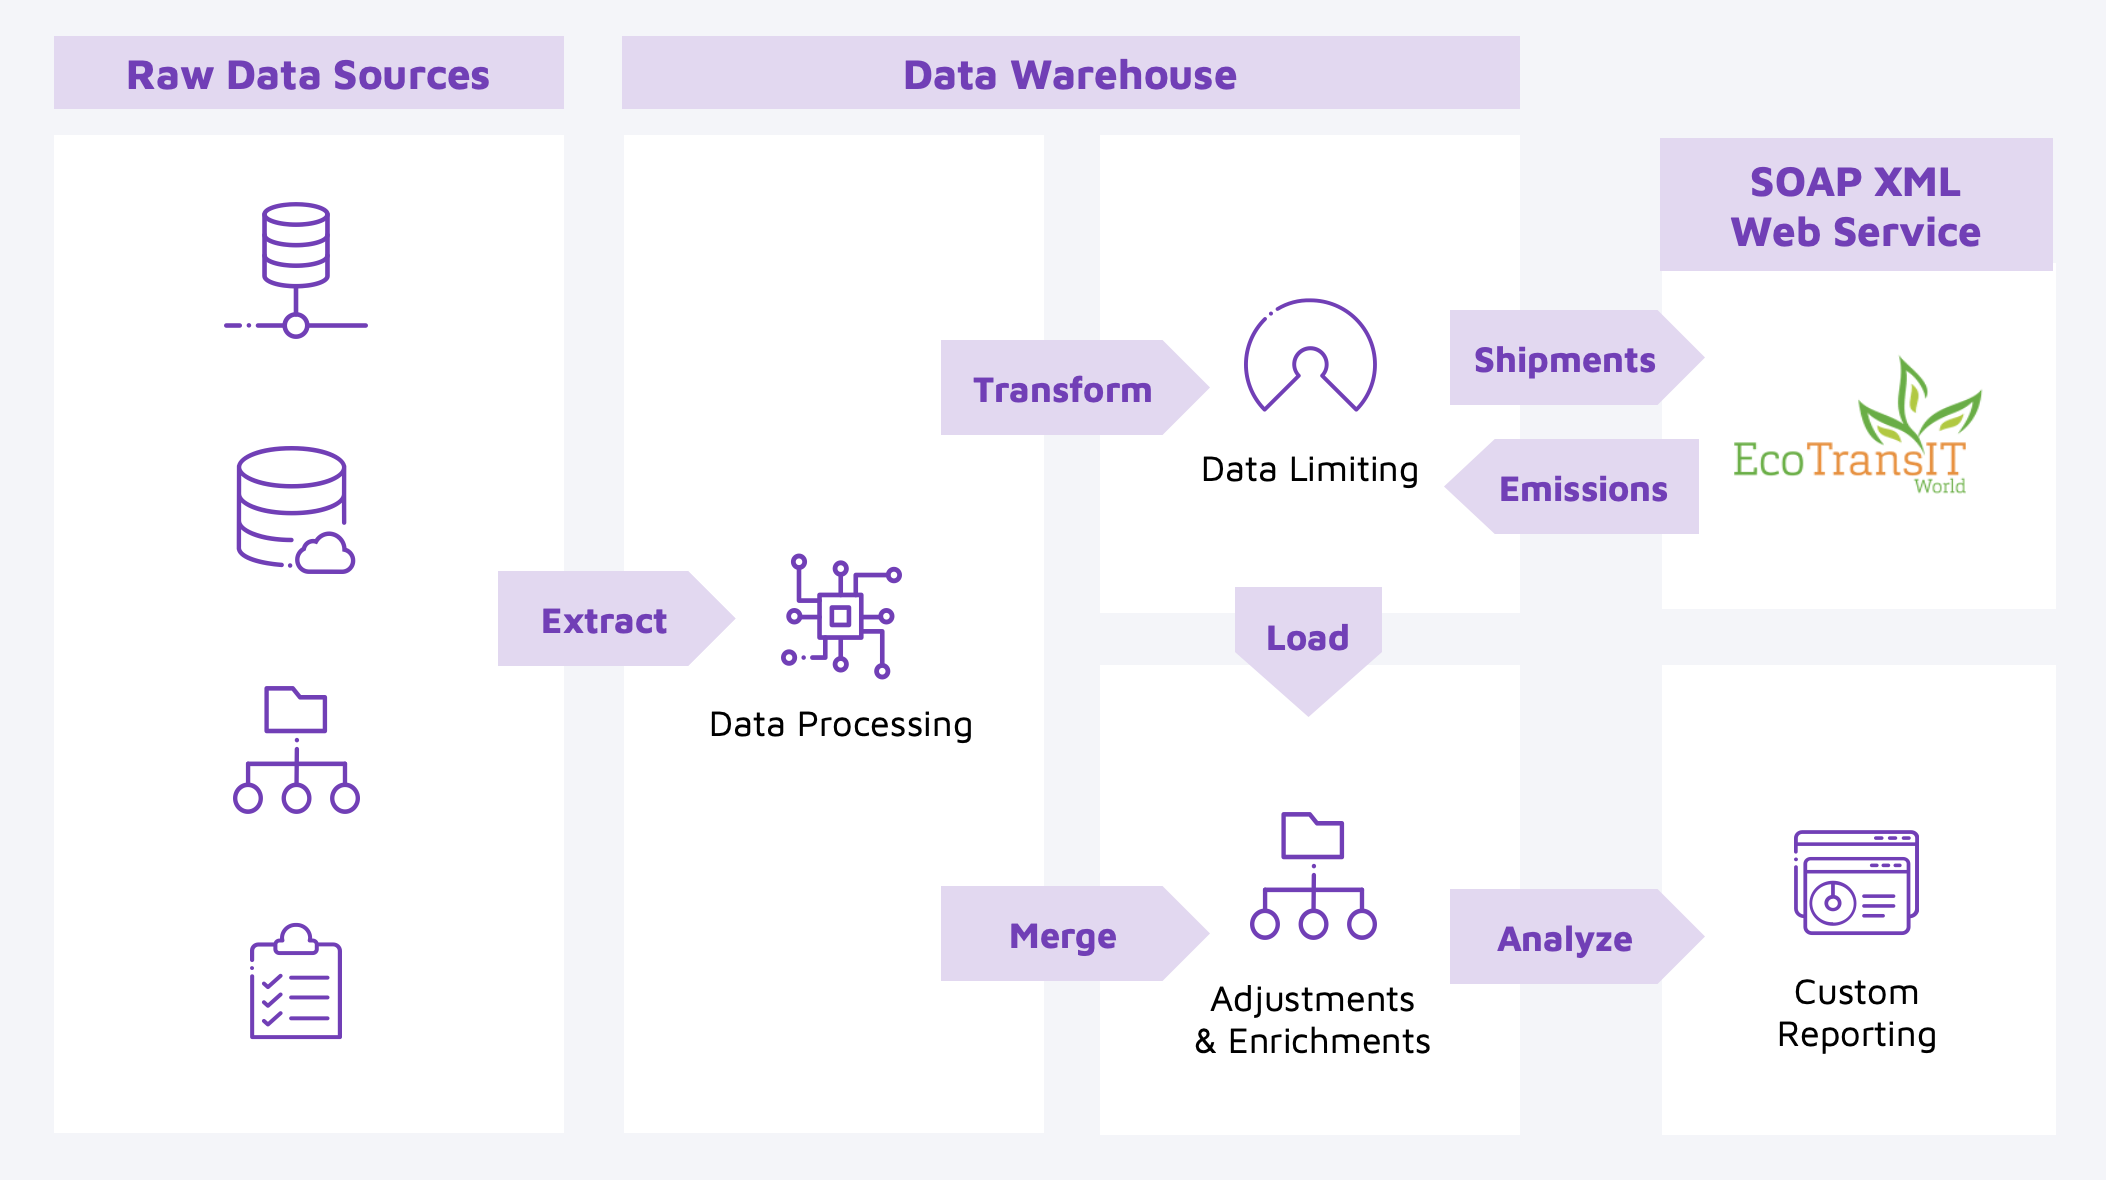
An overview of an architecture used for a CO2 emissions dashboard
The solution was built on Domo, mainly because the FMCG company’s data was already on the platform. Domo has an extract-transform-load (ETL) development environment seamlessly bundled with data storage and dashboard design capabilities. Domo also allows connectors (via APIs) to be built directly onto their platform.
We started with the raw data sources, and in this case, data on the FMCG company’s shipments. After cleansing the data, we developed a custom Domo connector that would integrate data and calculations from EcoTransIT World via SOAP API. Data is then updated and enriched with additional business details using the same process. The dashboard displays this data in different visualizations that the company’s end users then derive insights from.
The principles behind the implementation were to:
-
Minimize human interference and delays in communication.
-
Enable automation where business logic is set in all regions.
-
Clearly define the rules and standard for data mapping and management.
-
Create a centralized, global dashboard that’s easy to access and understand.
There are obvious caveats. Insights are only as rich, actionable, and purposeful as the data. Our project — and their goal to reduce CO2 emissions — were successful because the FMCG company effectively aggregated and operationalized vast amounts of their data.
Strategic effort, too, is required. Defining KPIs and setting meaningful targets require collaboration not just from the people who keep the supply chain running, but also with other people and organizations who can help achieve them. After all, reducing CO2 emissions is also about stilling the social and economic ripples that supply chains are responsible for.
Achieving sustainability through data and analytics
Data and analytics can help organizations develop meaningful ways to foster transparency and accountability, clearly define sustainability outcomes, and transform their business and the communities where they operate.
Lingaro Group provides end-to-end data intelligence that enables enterprises to achieve sustainability and improve the triple bottom line. Lingaro’s supply chain analytics practice works with global brands and enterprises in strategically utilizing data and modern technologies to realize sustainability goals and comply with regulations in ESG reporting. Backed by industry-recognized expertise and powered by AI, Lingaro helps organizations optimize business processes, identify opportunities for improving operations, and mitigate environmental, economic, and social risks in their supply and value chains.
To learn more about calculating CO2 emissions and our real-life case study, watch our webinar that we’ve organized with EcoTransIT World.
.png)
