


Lingaro Group worked with a multinational consumer-packaged goods (CPG) company that wanted to revamp its revenue growth management (RGM) strategy, including creating solutions that can flexibly and accurately optimize revenue and profit. The result? A 7% year-over-year (YoY) growth, with the success now being replicated to new markets around the world.
Data-driven and analytics-enabled RGM is built on a solid foundation of capabilities for driving growth through strategies that puts consumers at the forefront. This approach helps decision-makers better understand the impact of inflation, consumer behaviors, and pricing and trade promotions, which the CPG company lacked at the time.
Consumer behavior and finances are now more dynamic. Priorities are changing, too: 26% of financially flexible consumers use mobile apps to find better deals while 35% of global consumers are opting to shop at stores with discounts. In the US, 70% of surveyed shoppers said they look for discounts of up to 30% before buying.
Amidst an inflationary market and dynamic consumer behaviors, Lingaro’s consumer analytics practice organized the CPG company’s transformation in three stages, which accordingly grouped their needs and challenges:
|
RGM Data |
Pricing |
Promo Optimization |
|
- Manual data integration - Lack of data standardization - Infrequent data refreshes - Data not readily available |
- Manual calculation of price changes - Lack of price elasticity modeling - Inability to answer questions on approach and new strategy |
- Inconsistent selection of promo candidates - Lack of guidelines for trade spend - Limited visibility to cross-price elasticity |
RGM data integration and dashboard development
For this phase, Lingaro Group’s experts built a fully automated, easy-to-use dashboard that covers all relevant KPIs and monitors all market trends and competitors with up-to-date information. The integration and development involved:
-
Enabling data from multiple sources to be automatically integrated.
-
Building an interactive Power BI- and cloud-based dashboard to ensure high performance.
-
Automatically generating and delivering insights based on defined KPIs.
-
Adding an alerting system that notifies end users if metrics exceed or fail to meet thresholds.
The kinds of data integrated for the dashboards included the following:
-
Price landscape: Price trends, indices, architecture, and elasticity as well as willing-to-pay metrics
-
Promo landscape: Promo trends, promo vs. base, volume on deal, time on promo, and promo event analysis
-
Customer profitability: Growth drivers, trade margin overview, mutual profitability, and profit pools
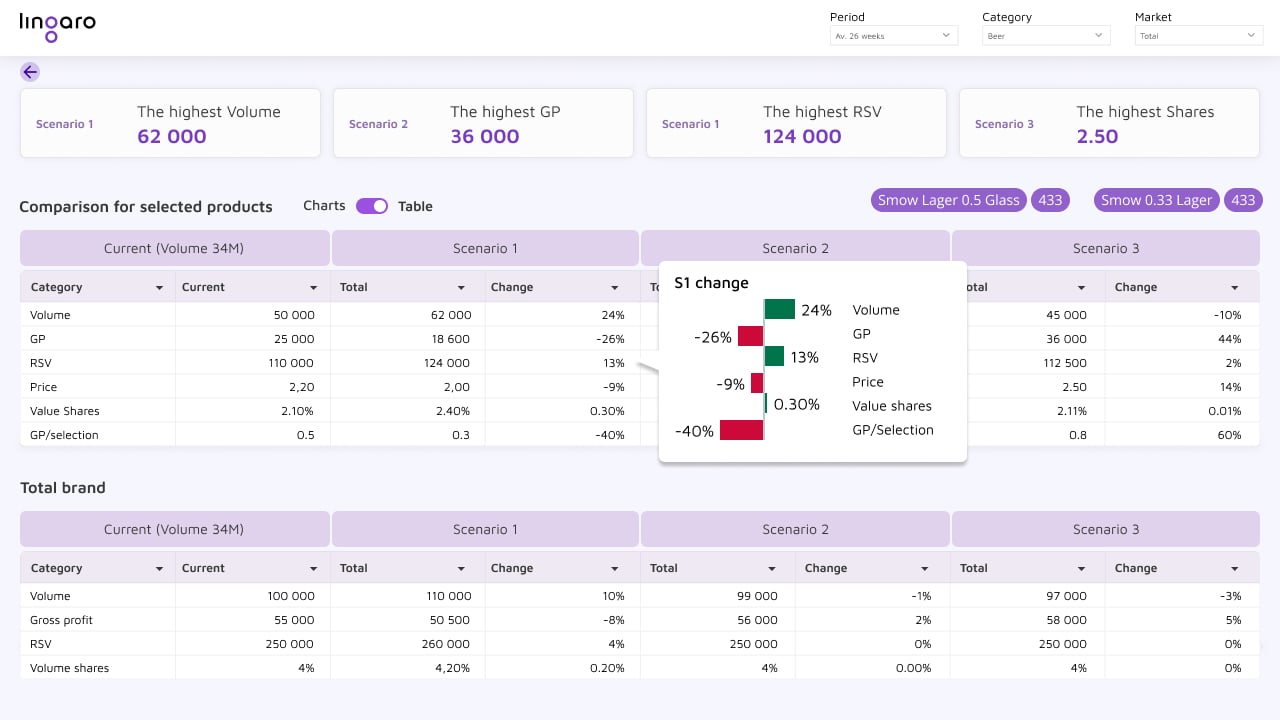
Figure 1. Sample visualization of how various kinds of RGM-related data can be integrated and visualized into a dashboard
Price optimization
In the second stage, Lingaro Group’s experts tested and validated all changes in pricing strategies, optimizing sales and profitability by selecting the best scenarios for the company. The solutions developed here included:
-
A price elasticity tool that also analyzes what-if scenarios and RGM plans.
-
An advanced forecasting tool that uses Causal ML, which includes cross-elasticity studies to assess the most optimal price points.
-
A database write-back functionality built in for storing and comparing individual simulations.
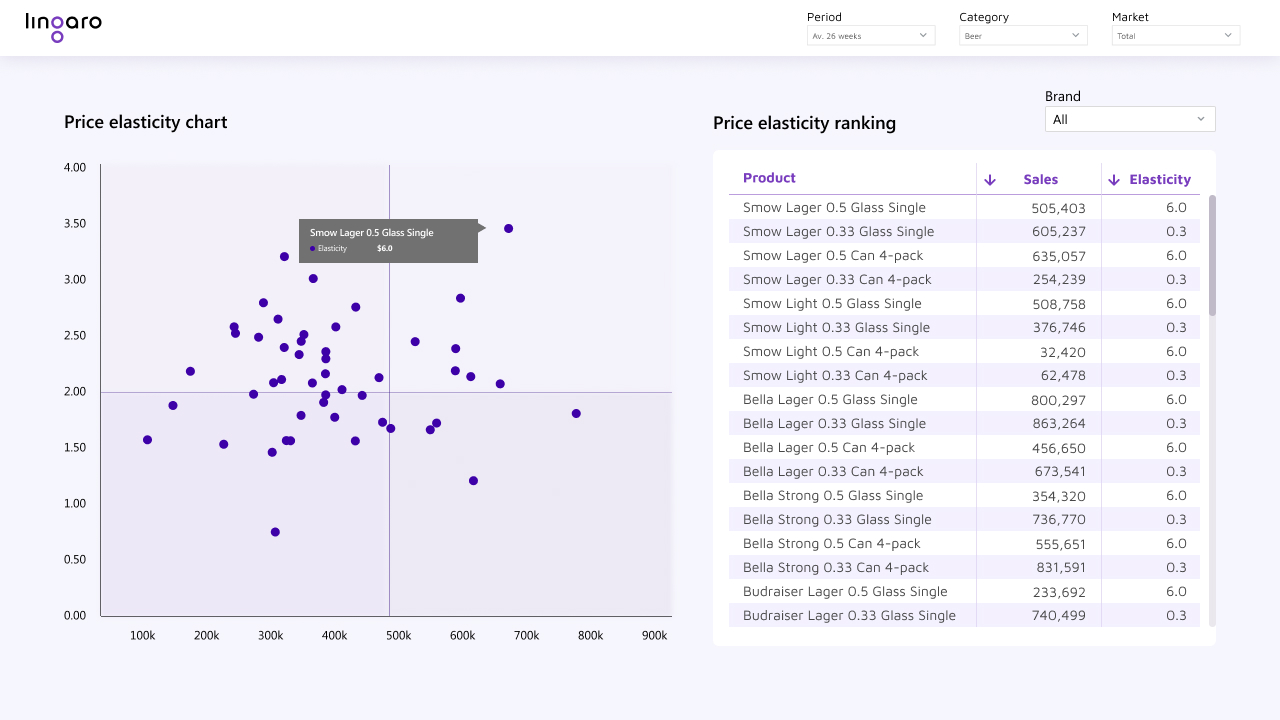
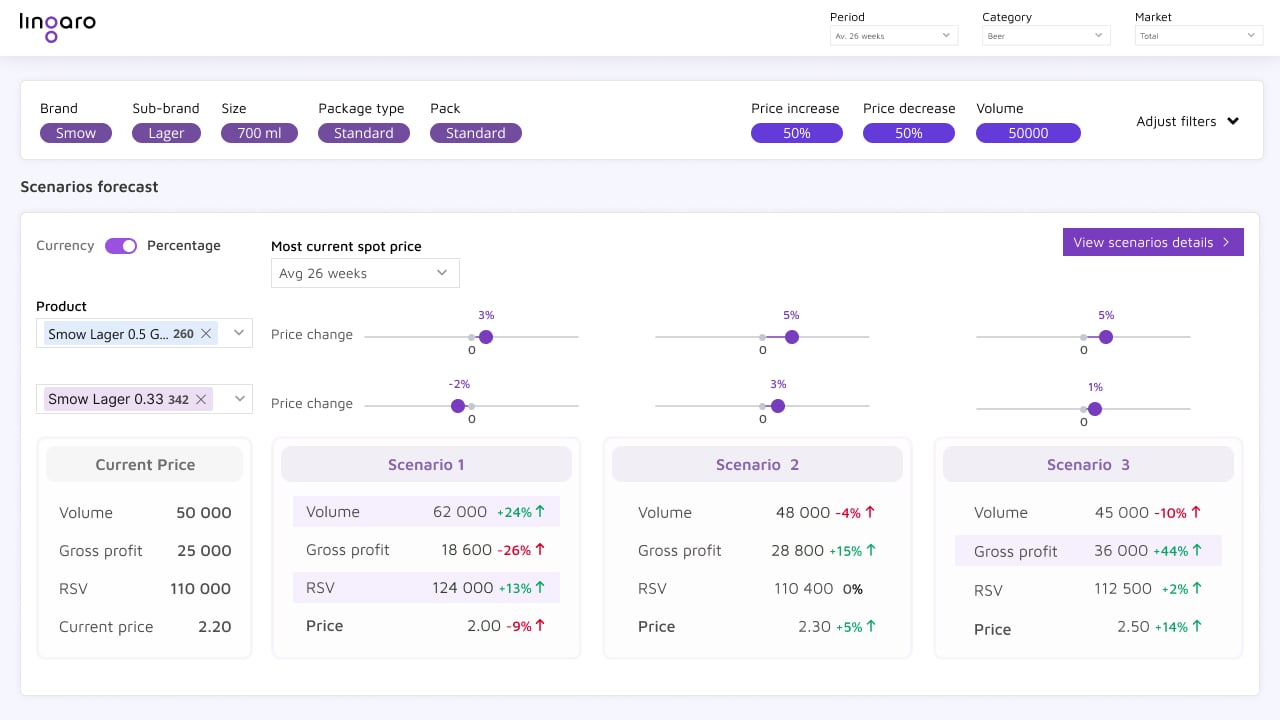
Figure 2. Sample visualizations of how pricing strategies could be analyzed
In this stage, the solutions showed:
-
Price correlations.
-
Price change simulations for all sales and financial metrics.
-
Comparison of optimal position and main competitive brands.
-
Possibilities for modeling many products at the same time.
-
Lifts for total brand/company to capture all cross-efficiency effects.
Promo effectiveness
Lingaro Group’s experts also developed solutions to identify the most effective promotions. Those with low impact and dilutive sales and deals were removed from the strategy. These solutions included:
-
Creating a promo library that classifies and recommends the most effective promotions for certain goals (e.g., lift and ROI analysis).
-
Providing promotional guidelines that review volume on deal and weeks on deal to optimize sales and profit.
-
Planning scenarios for different promotional plans, including elasticity and cross-efficiency.
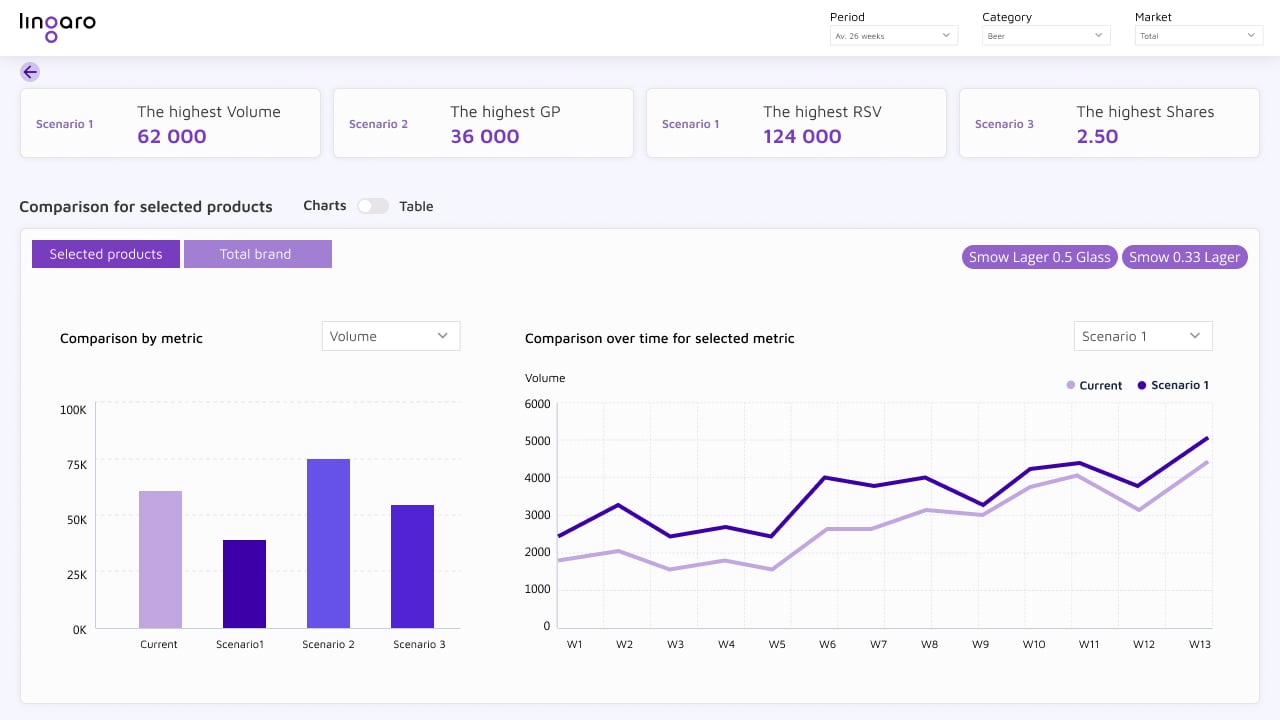
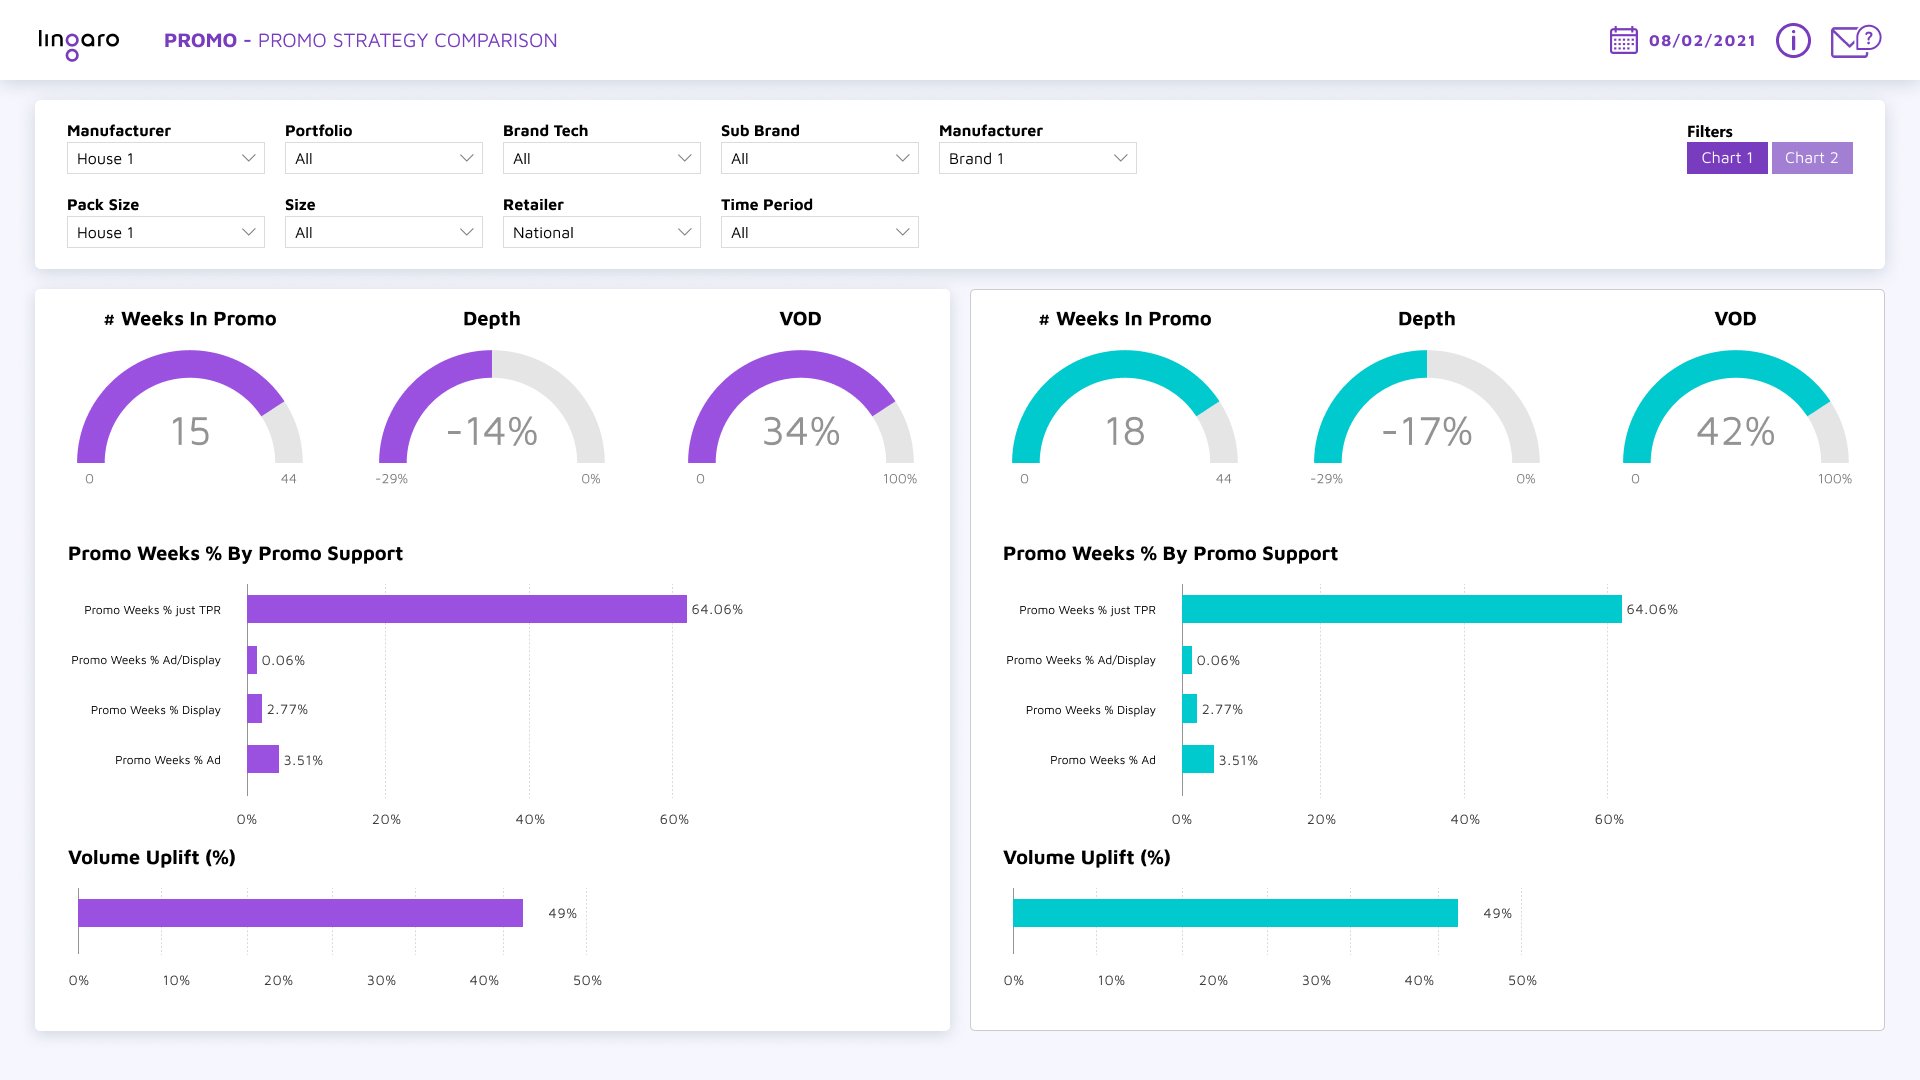
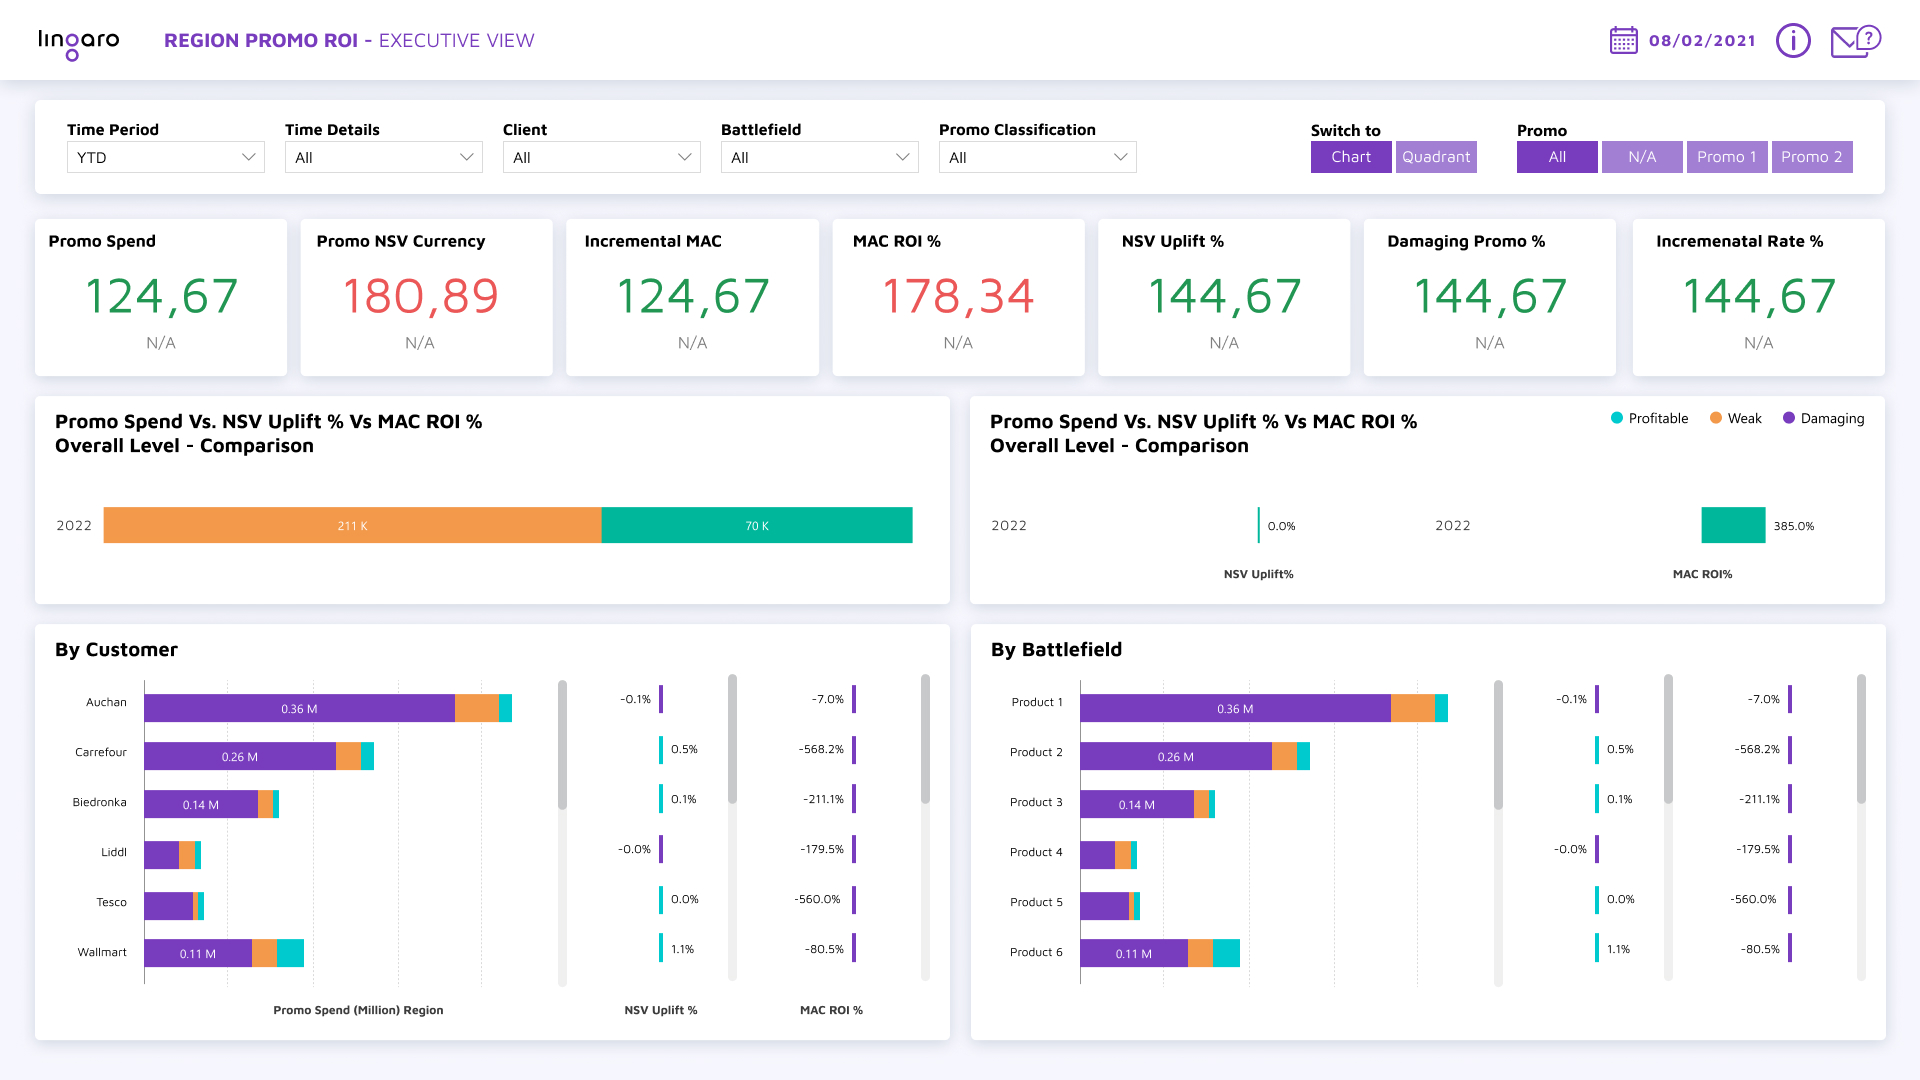
Figure 3. Sample visualizations of how the effectiveness of trade promotions could be analyzed
Results: 7% YoY growth in total revenue
With the solutions implemented across the business, the CPG company achieved a 7% YoY growth in terms of total/combined revenue. By adopting a data-driven and analytics-enabled approach to their new RGM strategy, the company:
-
Gained constant revenue and maximized profitability by regularly optimizing prices and promotions.
-
Saved significant time and resources (through automated, regular data refreshes) that were previously spent on manual analysis.
-
Enabled RGM processes to be flexibly implemented with more duration and frequency.
The success didn’t go unnoticed. The positive feedback from the RGM teams, in terms of how the solutions are adopted in day-to-day work, enabled the solutions to be further enriched by Lingaro Group’s consumer analytics practice and rolled out to new markets.
Sustaining revenue growth with data and analytics
Data and analytics can help bring out the best in the business’s people so they can elevate the organization’s commercial performance. However, it can come with caveats. Gathering and consolidating the necessary data to cover all the crucial KPIs would be arduous tasks, particularly for teams that don’t have the data readily available to them and the infrastructures required to process and manage it.
Regardless of their digital maturity and acumen, organizations need to establish a baseline and bridge the gap between their realities and aspirations. Companies can start by having data on average channel benchmarks. For price monitoring, some price points might not come with any sales data so they would not be useful for price elasticity, but they can be used to validate brand price ladders.
Another alternative is to consider how historical data can be used in line with market trends, although it might be challenging to predict trends given how volatile they could be. On the other hand, tracking market dynamics can be a baseline for defining and testing new RGM strategies. Sometimes the right kinds of data might not be accessible or available, but what’s crucial is to be more data-driven. This enables the company to pave a solid foundation from which it can build the capabilities needed for RGM.
Many CPG and FMCG companies are learning to create, add, and deliver value from revenue growth management. In fact, nearly half of surveyed FMCG companies are expected to immediately invest in capabilities in trade promotion management (TPM) and RGM, including scaling TPM and RGM solutions as well as embedding AI into their existing tools and processes. Today’s volatile market is challenging businesses to rethink their strategy, and advanced analytics can help in building new road maps for navigating an inflationary, dynamic consumer landscape.
Download our white paper, “Outthinking Inflation: A Paradigm Shift to Revenue Growth Management,” to learn about a data-driven approach for managing and growing revenue and how advanced analytics can help elevate the organization’s commercial performance.