


Trade promotions have always been a source of a company’s top- and bottom-line growth, particularly CPG companies. Businesses and brands need to differentiate themselves, but this continues to be a challenge especially in this new normal. Data and analytics can help paint a clearer picture of where, when, and how to execute trade promotions that will improve margins, get the most out of their investment, and sustain impact among consumers.
In 2017, consumer-packaged-goods (CPG) companies around the world reportedly invested around 20% of their annual revenue in trade promotions. Remarkably, 59% lost their money. What happened?
For many companies and brands, trade promotions are often one of the most expensive in their profit and loss (P&L) statements. Oddly enough, many still struggle to connect the dots, plan ahead, unravel their complexities, and cash in on their full potential. For instance, CPG companies alone spend more than US$1 trillion in global trade investments. More than 70% of investments made in trade promotions, however, don’t ever return.
Trade promotions are a staple in many businesses. Consumers, after all, love — and sometimes even demand — promotions and bargains. So much so that 70% of surveyed shoppers said they look for as much as 30% discount before committing to a purchase. If your company can’t prepare a suitable offer, your competitors will — with your customers in tow to boot. Promotions can increase and optimize your company’s sales and profit, but they can do more harm than good when planned and implemented poorly.
But how can you make your company’s promotions more effective? Can you foresee which promotion will improve your sales and margin? Of course, there’s no simple answer. More importantly, the biggest challenges are building a comprehensive strategy and developing reporting tools with optimization logic to measure the performance and effectiveness of a promotion.
Here, we won’t focus on extreme situations spurred by the pandemic and global supply chain disruptions. As we live through the new normal, however, you’ll need to reimagine how you plan and execute trade promotions not only to drive sales but also to carve a niche and reposition the company — and its brand and products — to consumers.
Why trade promotions are important
To better understand performance and effectiveness, let’s define trade promotions first. Trade promotions are activities that provide special offers and incentives to members of a distribution channel. These include coupons, discounts, promo codes, rebates, value-added bonuses, incentives, or premiums, and other methods to drive sales and improve a product or service’s profitability using final price as a main selling point. In the CPG space, for instance, trade promotions are often planned jointly by manufacturers and retailers to feature a product emphasized through price, communication, and visibility.
Trade promotions aren’t just for sales. They also:
-
Enhance product or brand awareness.
-
Build market share.
-
Increase demand on a retailer level.
-
Serve as a response to a competitor’s own promotional activity.
-
Strengthen relationships with clients, distributors, and retailers.
-
Introduce a new product or reintroduce an existing product with new features or visuals.
-
Improve customer traffic or loyalty.
-
Increase basket size (i.e., items/products sold per transaction).
-
Adjust price perception.
In a real-life case study, a European CPG company consolidated financial and consumer data to analyze patterns between levels of consumption and the trade promotions they’ve executed. The data revealed that their trade promotions fared better — albeit in short term — than their competitors’ in terms of basket size. They then fine-tuned their promotions with the retailer to maximize basket uplifts. They also introduced new promotions aimed at attracting and penetrating new consumers, which are more aligned with their strategic, long-term goals.
Indeed, there are quite a few situations where trade promotions can be used. Before assessing their effectiveness, you need to define a specific target or goal for each promotion.
Analyzing trade promotions: Sales and profit KPIs
When assessing trade promotions based on sales or profit, a good starting point is to define specific, relevant KPIs. In this case, incremental values are the easiest and the most logical to introduce. To calculate these, you need to look into the baseline sales of your products.
Incremental analysis assumes that every promotional activity generates a lift from the baseline. The higher the lift, the more effective the trade promotion is. Here, you can also add specific promotional classifications, which can be helpful when examining which trade promotions should be continued, and which ones should be removed from your plans.
Drawing on your classifications, you can then consider what trade promotion would:
-
Generate incremental sales and profit, which are typically the most effective deals.
-
Dilute the margin but increase sales, which works best for specific sales targets where a certain level of margin is sacrificed to build sales and market share.
-
Weaken sales, where the total value of sales is lower than sales without promotions.
-
Involve high costs, which would dilute the margin and wouldn’t result in significant increase in sales even with additional funding.
-
Make low impact, where there’s minimal lift in sales and profit.
Calculating incremental sales and profit
There’s also an important aspect to consider when calculating incremental sales and profit: defining what to include in final calculations. Let’s consider the following graph as an example of how incremental sales might look like:
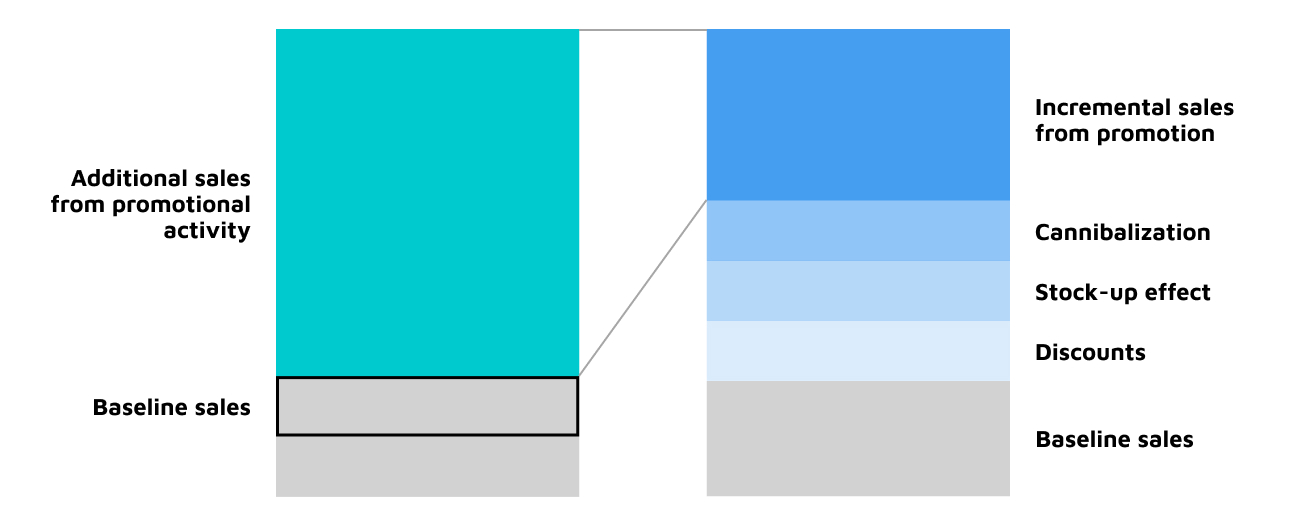
A visualization of how incremental sales and profit are calculated
With incremental profit, you can find more elements to include in the calculation, such as additional spending for running promotions. You can also incorporate additional measures to track the trade promotion’s performance and integrate KPIs or metrics to monitor its effectiveness. These can include:
-
Volume on deal. This includes how much of sales goes through promotions compared with other periods or competitors. This helps indicate the time when a promotion’s effectiveness is decreasing.
-
Promo depth. This covers how big the discount is and if there’s any correlation between price markdowns and a trade promotion’s effectiveness.
-
Promo frequency. This involves how often certain products/brands are promoted, and if you’re executing effective trade promotions more often.
Visualizing trade promotions
Once you’ve defined the KPIs and figured out how to calculate them, you can analyze past promotions. Here, you can better determine if they’re worth repeating, if they align with the KPIs you’ve set, and if there are elements from previous successful trade promotions that you can incorporate in your new ones.
First, you’d need to find the business logic to separate promotional activity from sales data, and then calculate the KPI for each promotional activity. By making these calculations for every past deal or promotion, you’ll create a huge promotional library that will give you the information and insights about what trade promotions were and weren’t effective.
Once you’ve made this library, you can then organize a database of your company’s deals or promotions. You can further organize it through dimensions such as market, distribution channel, client, and brand. Depending on the scale of your business and the time it would take to organize such huge data, it might be difficult, if not impossible, for your stakeholders to analyze it. This is where reporting capabilities come in handy, where you can consolidate different kinds of data and visualize them into reports that your stakeholders will find easier to access, understand, and derive actionable insights from.
Having a single source of truth also helps. By aggregating data into a single, centralized repository, everyone in your company gets the same holistic view of data. This, in turn, paves the way for smoother collaboration, especially when developing new plans for trade promotions.
Incorporating analytics to trade promotions
Across various markets, 20% – 40% of consumers around the world switched brands during the pandemic, highlighting the importance of trade promotions to entice and retain consumers. In today’s new normal, consumer habits and behaviors as well as market dynamics constantly change. Companies and brands need to rethink how trade promotions can figure into their business’s growth.
Data and analytics, supported by the right technologies, can provide actionable insights that trade marketing and account managers as well decision-makers need to better understand the impact of their promotional activities and maximize their ROI. In a 2020 study, for instance, researchers demonstrated how optimizing/upgrading trade promotions through data and analytics can help grocery and outdoor retailers in the US increase profits by up to 10%. A recent survey, too, reported that 58% of CPG companies cite the need for capabilities in data and analytics as well as firmer grasp on dynamic consumer trends to achieve growth.
Lingaro’s consumer analytics practice provide solutions that transform data into commercial excellence. Our data-driven approach to revenue growth management, complemented by advanced analytics, enables global brands and enterprises that we work with to optimize trade promotions, predict future sales, and devise optimal campaigns as well as pricing strategies. Lingaro’s capabilities cover the entire consumer journey — from branding, consumer voice, campaign management, and direct-to-consumer models to marketing.

.jpg?width=528&height=313&name=1890%2014-(Compressify.io).jpg)
