Promotion uplift is the incremental sales a promotion generates above what would have sold anyway. For CPG companies, accurate measurement starts with a credible baseline, adjusts for pull-forward, cannibalization, and halo effects, and judges success by net incremental profit, not the sales spike.
Key Benefits
-
Smarter trade spend: Fund promotions that create real incremental volume and cut those that subsidize existing demand.
-
Higher promotional ROI: Evaluate events on net incremental profit, not gross volume.
-
Better forecasting: Use reliable uplift estimates to plan inventory and production.
-
Stronger retailer negotiations: Equip your sales team with account-specific evidence for joint business planning.
-
Continuous improvement: Build a library of the mechanics, discount depths, and retailers that work best.
Why promotion uplift matters
Illustrative example based on a published industry scenario; figures are hypothetical. Trade promotions are among the largest investments CPG companies make, at 20–30% of gross sales. Yet McKinsey & Company found that 72% of US trade promotions fail to generate a profit.
The problem is rarely the spending; it is the measurement. A spike during promoted periods can look like success while eroding margin: shoppers may have stocked up early, switched SKUs, or bought at a discount what they would have bought anyway.
Without measuring true promotion uplift, growth and noise look the same. As the example below shows, a promotion can look like a 2.3x return and still lose money. Each account and promotion mechanic (price cut, display, or feature) behaves differently, so CPG companies need reliable data sources and a repeatable way to separate incremental demand from baseline sales.
What is promotion uplift?
Promotion uplift (or promotional lift) is the extra volume or revenue a promotion generates above the baseline, the sales you would have had without it:
-
Incremental sales = Promoted sales − Baseline sales
-
Uplift % = Incremental sales ÷ Baseline sales × 100
For example, if a product normally sells 10,000 units in four weeks and sells 14,000 during a promotion, gross uplift is 4,000 units, or 40%. Measure in units first; revenue uplift is lower because promoted units sell at a discount. The hard part, and the main source of error, is a credible baseline that accounts for seasonality, trends, distribution, and competitor activity.
Gross uplift vs. net uplift
Not every unit sold above baseline is new demand, and not every discounted unit is a gain. Gross uplift blends these components, plus one hidden cost:
-
Truly incremental volume: New buyers, increased consumption, or category expansion.
-
Pull-forward (pantry loading): Existing shoppers buying earlier than they otherwise would, often followed by a post-promotion dip.
-
Cannibalization: Shoppers switching from your other SKUs or pack sizes to the promoted item.
-
Temporary competitor switching: Volume taken from rivals that usually returns afterward, not a lasting share gain.
-
Dead weight: Loyal shoppers who would have paid full price anyway. They sit inside the baseline, so they do not inflate uplift, but discounting them is a real cost.
Halo effects work the other way: a promotion can boost related products and deserves credit for that. For simplicity, the illustrative example below adjusts only for pull-forward and cannibalization.
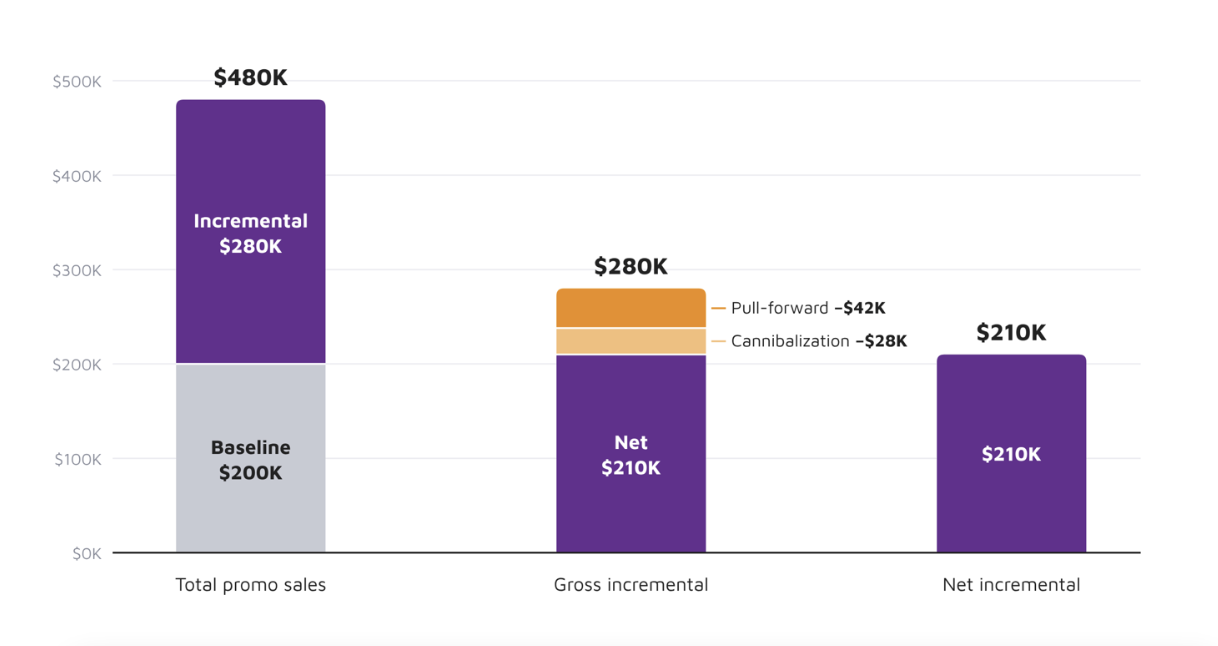
On gross numbers, the promotion returns $2.33 in revenue per dollar spent; after pull-forward and cannibalization, just $1.75. That gap separates a promotion that looks good from one a CPG brand can confidently repeat. And $1.75 is still revenue.
At a hypothetical 40% gross margin, $210,000 of net incremental revenue is only $84,000 of profit, less than the $120,000 cost. A 15% discount that drives 30% uplift is a very different investment from a 30% discount that drives 32%: the deeper discount doubles the margin given away on every unit for almost no extra volume.
Five methods to measure promotion uplift
There is no single right method; the choice depends on your data, analytical maturity, and decision. Most CPG companies combine several.
-
Pre/Post and Historical Comparisons
Compares promoted sales with past periods, such as the prior weeks or last year. It is quick but vulnerable to seasonality, trends, and competitor activity, so use it for directional reads only.
-
Syndicated Data Decomposition
Syndicated data providers split sales into base and incremental volume using a rolling 4-to-12-week average of non-promoted sales. It is a practical start, but baseline logic varies by provider and rarely captures pantry loading.
-
Test-and-Control Experiments
Comparing promoted stores or regions with matched non-promoted ones isolates causal impact. The challenge is execution: retailers must agree, and control stores must be truly comparable.
-
Econometric and Regression Modeling
Statistical models control for many demand drivers at once (price, distribution, seasonality, holidays, weather, competitor promotions). They are accurate when built well but need clean, granular data and specialist skills.
-
Machine Learning Baseline and Uplift Models
Trade promotion optimization (TPO) platforms use machine learning to build baselines for every SKU, retailer, and week, refresh them in near real time, and predict uplift by mechanic. Accuracy depends on data quality.
Choose a method using pre/post and syndicated data for directional reads, test-and-control for causal proof on high-stakes events, and econometric or machine learning models once you have clean, granular data at scale.
Steps for measuring promotion uplift
-
Define the objective and scope: Agree on success metrics (volume, revenue, profit, or category growth) and the SKUs, retailers, and time windows in scope.
-
Build a reliable data foundation: Combine sell-out (sales to shoppers), sell-in (shipments to retailers), trade spend, pricing, and promotion calendar data by SKU, account, and week.
-
Establish a credible baseline: Use control groups where possible and modeled baselines elsewhere (see the five methods above), adjusted for seasonality and trend.
-
Measure gross uplift: Calculate incremental volume and revenue during promoted periods.
-
Adjust for pull-forward: Track sales for 4–6 weeks after the promotion; with the next step, this gives net uplift.
-
Analyze portfolio-level sales: Measure cannibalization and halo.
-
Calculate profitability: Compare net incremental gross profit with the full cost: discounts, retailer funding, display fees, and margin lost on baseline volume.
-
Test for significance: Use confidence intervals or statistical tests to confirm the lift is real before acting.
-
Feed insights back into planning: Store results in a promotion library so future planning relies on data.
Common pitfalls to avoid
-
Treating the spike as the result. Ignoring the post-promotion dip often overstates lift by 15–30%.
-
Measuring only at SKU level. Evaluate promoted items at brand and category level to capture cannibalization.
-
Relying on aggregated national data. Blended totals hide differences across retailers.
-
Ignoring competitor activity. An overlapping competitor promotion can mask or inflate measured uplift.
-
Measuring shipments instead of consumer sales. Sell-in includes retailer forward buying; use sell-out data where possible.
-
Confusing revenue with profit. As the worked example shows, a deep discount can boost sales volume but cut total profit.
From measurement to action with Lingaro's RGM Intelligence Platform
Measuring promotion uplift only matters if it changes what happens next. Leading CPG companies use it to refine their promotion strategy: the calendar, discount depth and frequency, and mechanics for each retailer.
The methods above mostly look backward. Lingaro's RGM (revenue growth management) Intelligence Platform looks forward. It uses causal AI and scenario simulation to explain why results changed, predict what happens next, and recommend the best action before you spend:
Promo optimization: Measure true incremental uplift and separate it from seasonality, loyal-buyer spend, and cannibalization. Trade spends optimization: Shift budget to the promo mechanics that drive sales most effectively.
Suggested pricing and promo: Simulate price and promotion scenarios to see how they affect volume and margin before deciding.
The goal is not more trade spend but redirecting the existing budget to higher-performing areas. With enough data and adoption, teams can achieve up to 15% more effective promotions and up to 5% margin uplift.
Conclusion
Promotion uplift is one of the most important numbers in trade promotion management (TPM), and one of the easiest to get wrong. Start with a credible baseline, look beyond the spike to net impact, and judge success by profit, not volume. Whatever the method, the goal is to know which promotions create value and invest accordingly.
To see RGM Intelligence Platformin practice, try the 3-minute demo. It is self-guided, interactive, and has no sales pitch.
FAQs
What is promotion uplift?
The additional sales a promotion generates above the baseline.
How do you calculate promotion uplift?
Subtract baseline sales from promoted sales, then divide by baseline sales to express it as a percentage.
What is a baseline in promotion analysis?
An estimate of what a product would sell without promotion, adjusted for seasonality and distribution.
Why is gross uplift misleading?
It counts pull-forward and cannibalized volume as new demand and ignores the cost of discounting dead-weight sales, overstating true impact.
How long should you measure after a promotion?
Typically 4–6 weeks, to capture post-promotion dips caused by pantry loading.